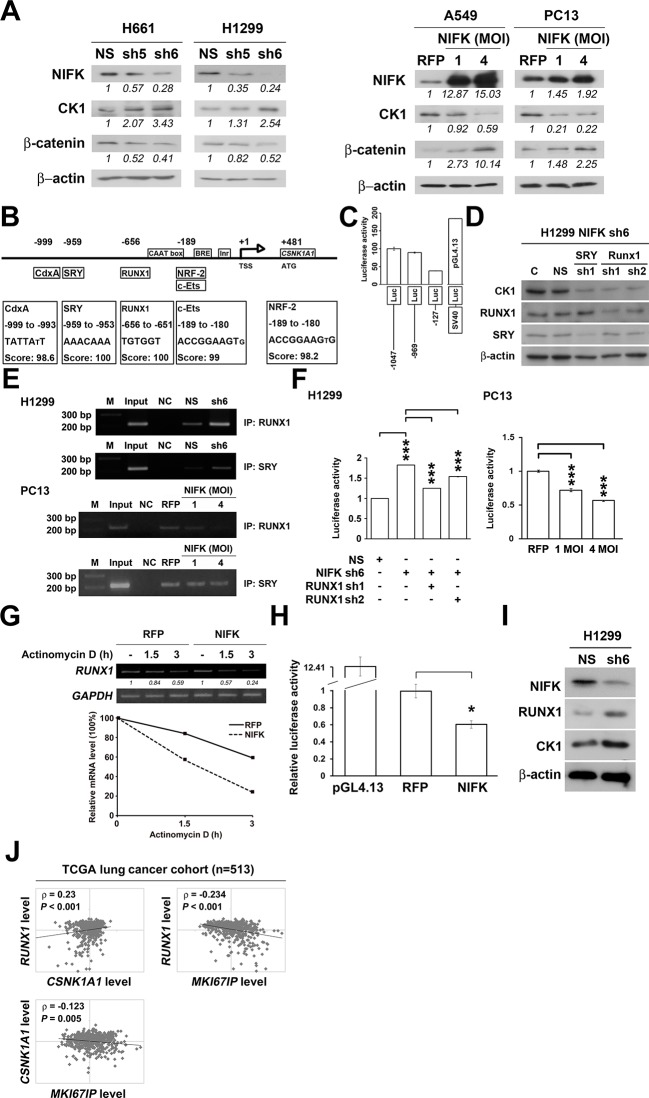
Figure 6. NIFK regulates CK1α expression via the destabilization of transcription factor RUNX1.
(A) Left, the levels of CK1α and β-catenin in H661 and H1299 cells after NIFK knockdown. Right, the levels of the indicated molecules in A549 and PC13 cells upon NIFK overexpression. (B) Identification of cis-regulatory elements within the CSNK1A1 (Ensembl:ENSG00000113712) promoter region. The locations of the consensus binding sites relative to the transcription start site (TSS) are presented below the indicated transcription factors. The scores were calculated by the TFSEARCH website according to the matched sequences. BRE, B recognition element. Inr, initiator element. (C) The CK1 promoter region from -969 to -127 bp is important for transcriptional activation. The relative luciferase activity was measured 48 hr post-transfection with a reporter plasmid containing the CK1 promoter or the indicated deletion mutant. (D) The expression of the indicated molecules after the knockdown of the transcription factors SRY and RUNX1 in the NIFK-silenced H1299 cell clone sh6. (E) ChIP was performed on H1299 (Top) and PC13 cells (Bottom) using antibodies against RUNX1 and SRY. M, DNA marker. NC, negative beads control. (F) A CK1 promoter reporter assay was performed on NIFK-silenced H1299 cells (Left) and in NIFK-overexpressing PC13 cells (Right). The cells were lysed 48 hr after reporter plasmid transfection. The relative luciferase activity was normalized to the number of cells and was quantified. (G) A549 cells were transiently transfected with RFP control or NIFK by lipofection. After 48 h, cells were treated with actinomycin D (5 μg/ml) for indicated time points. Relative RUNX1 mRNA levels were analyzed by RT-PCR. (H) RUNX1 promoter activity was measured after 48 hr of transfection by liposome. (I) NIFK, CK1α and RUNX1 protein levels were analyzed in H1299 cells upon NIFK silencing. (J) Correlation between the expression levels of the indicated molecules in the lung cancer cohort. The microarray data were retrieved from the TCGA database (genomic_TCGA_LUAD_exp_HiSeqV2_percentile_clinical).
Figure 6—figure supplement 1. A549 and PC13 cells were transfected with Flag-tagged NIFK or a vector control for 48 hr.
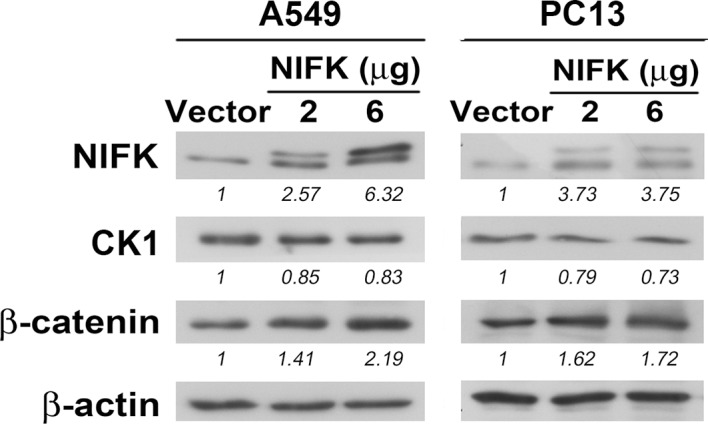
Figure 6—figure supplement 2. RUNX1 and SRY are potential transcription factors of CK1α.
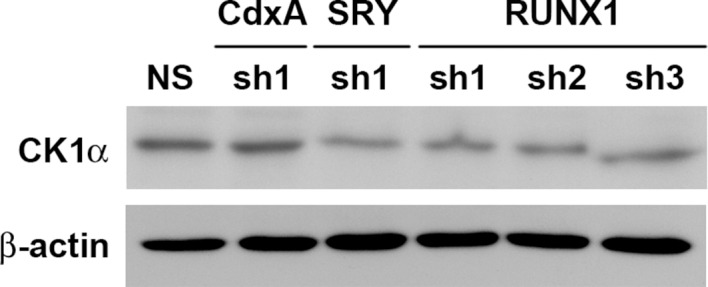
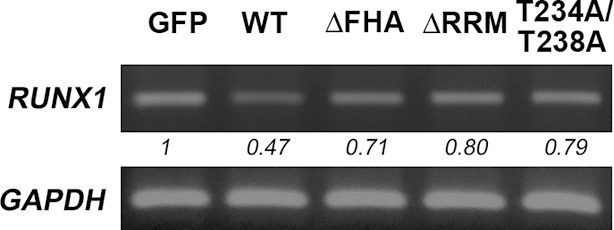
Figure 6—figure supplement 3. NIFK overexpression leads to RUNX1 mRNA instability.
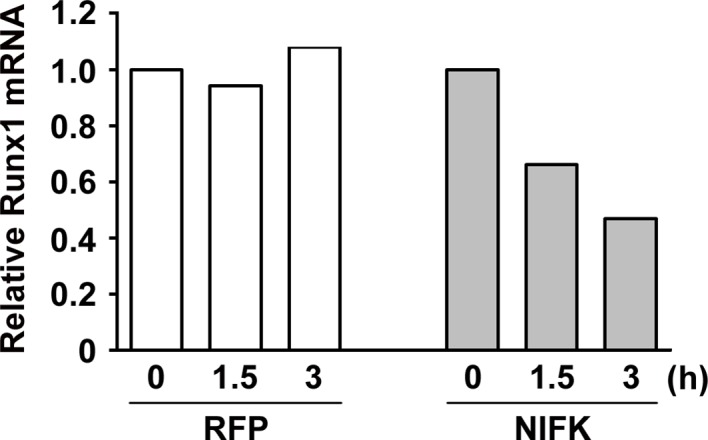
Figure 6—figure supplement 4. NIFK decreases RUNX1 at RNA level.
