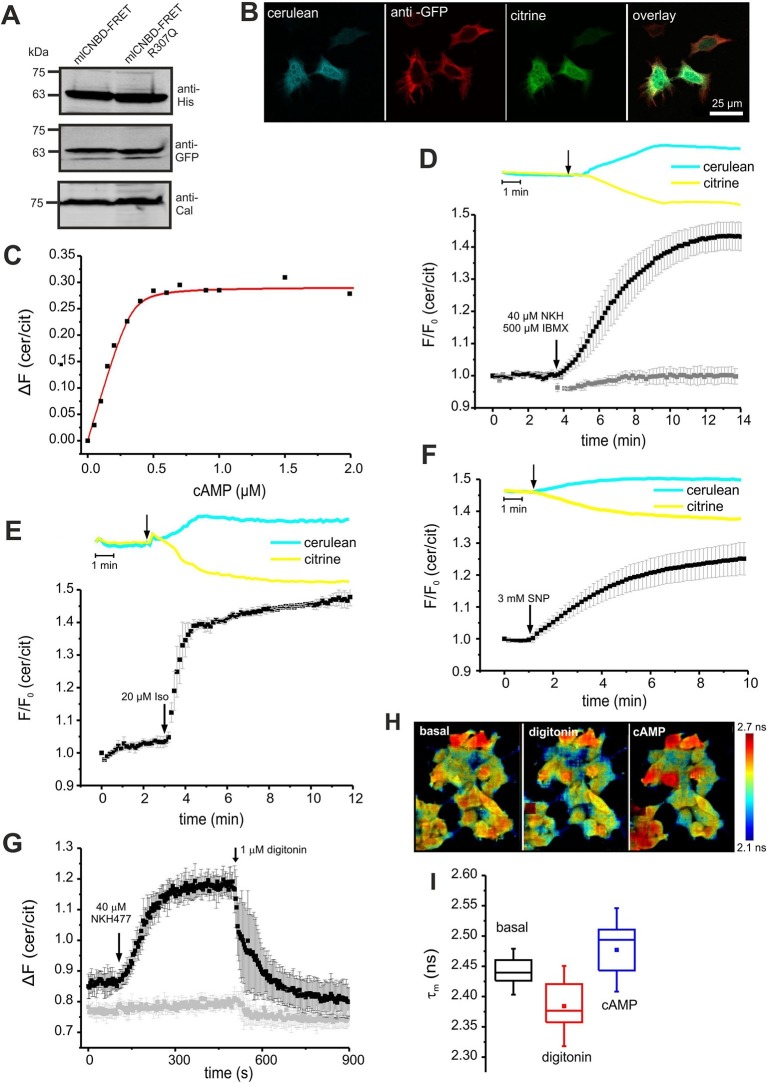
Figure 3. Characterization of mlCNBD-FRET in HEK293 cells.
(A). Representative Western blot using total protein lysates from mlCNBD-FRET and mlCNBD-FRET-R307Q-expressing cells, stained with an anti-His and an anti-GFP antibody. Calnexin (Cal) has been used as a loading control. (B) Immunocytochemistry. HEK293 cells expressing mlCNBD-FRET (cerulean: blue, citrine: green) have been labeled with an anti-GFP antibody and a fluorescent secondary antibody (red). Scale bar 25 µm. (C) Ligand binding of cAMP to mlCNBD-FRET in HEK293 cells determined by fluorescence spectroscopy. Representative experiment showing an increase of the baseline-corrected cerulean/citrine emission ratio ΔF of mlCNBD-FRET (430 nm excitation) at different cAMP concentrations. Cells have been permeabilized with 20 μM digitonin before addition of cAMP. Data have been fitted using a single binding-site model (red line) (Cukkemane et al., 2007). (D) Changes in FRET in HEK293 cells expressing mlCNBD-FRET after stimulation with 40 μM NKH477/500 μM IBMX. FRET has been measured by fluorescence microscopy. Representative traces of raw data are shown above. HEK293 cells expressing mlCNBD-FRET-R307Q (grey) have been used as a control. Data are presented as mean ± S.D. (mlCNBD-FRET: n = 31; mlCNBD-FRETR307Q: n = 3). (E) Changes in FRET in HEK293 cells expressing mlCNBD-FRET after stimulation with 2 μM isoproterenol. Representative traces for the raw data are shown above. Data are presented as mean ± S.D.; n = 9. (F) Changes in FRET in HEK293 cells expressing mlCNBD-FRET after stimulation with 3 mM SNP. Representative traces for the raw data are shown above. Data are presented as mean ± S.D.; n = 36. (G) Changes in FRET in HEK293 cells expressing mlCNBD-FRET (black) or mlCNBD-FRET-R307Q (grey) after stimulation with 40 μM NKH477. After reaching a steady-state, cells have been permeabilized using 1 μM digitonin. FRET has been measured using spectrofluorometer. Data are presented as mean ± S.D.; n = 3. (H) Changes in cerulean fluorescence lifetime using FLIM. HEK293 cells expressing mlCNBD-FRET were imaged under basal conditions, after addition of 20 μM digitonin, and the following addition of 5 μM cAMP. The cerulean fluorescence decay was recorded and fitted with a bi-exponential decay to calculate the lifetime. Data are presented as mean ± S.D. Representative images are shown using a look-up table ranging from 2.1 ns (blue) to 2.7 ns (red). (I) Mean values of the two lifetimes averaged over different regions of interest in part (H); n = 8 for each condition.


