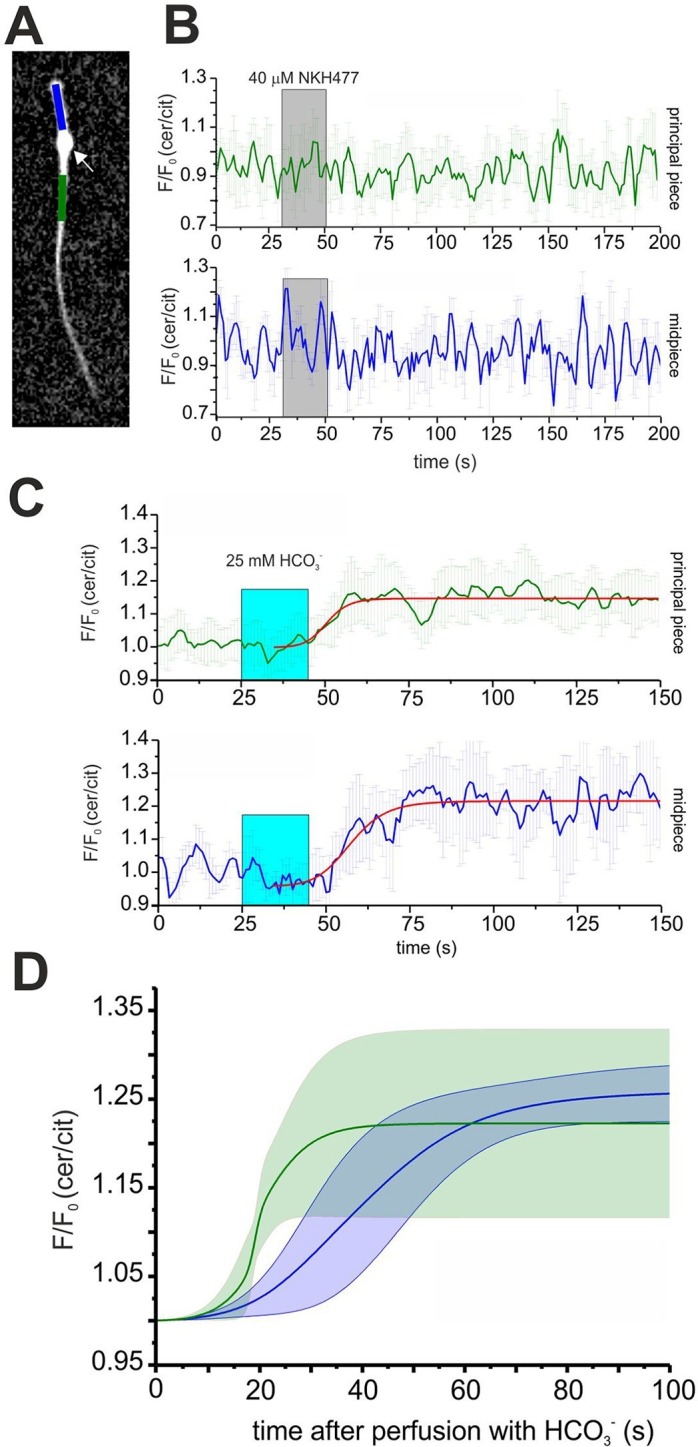
Figure 6. Spatio-temporal cAMP dynamics in the sperm flagellum.

(A) cAMP dynamics was analyzed in a region 20 µm in length in the midpiece (blue) and principal piece (green) of freely beating sperm. The cytoplasmic droplet is indicated with an arrow. (B) Changes in FRET after stimulation with 40 μM NKH477. The perfusion with NKH477 is indicated with a grey box. Data for a representative cell are shown as mean ± S.D. in the midpiece (blue) and principal piece (green). (C) Changes in FRET after stimulation with 25 mM bicarbonate. The perfusion with bicarbonate is indicated with a blue box. Individual traces have been fitted using logistic regression (Origin 9) (red line). (D) Average of the fitted data presented in (C). The blue and green line represent the mean value for the midpiece and principal piece, respectively (n = 7). The blue and green areas represent the corresponding S.D.
