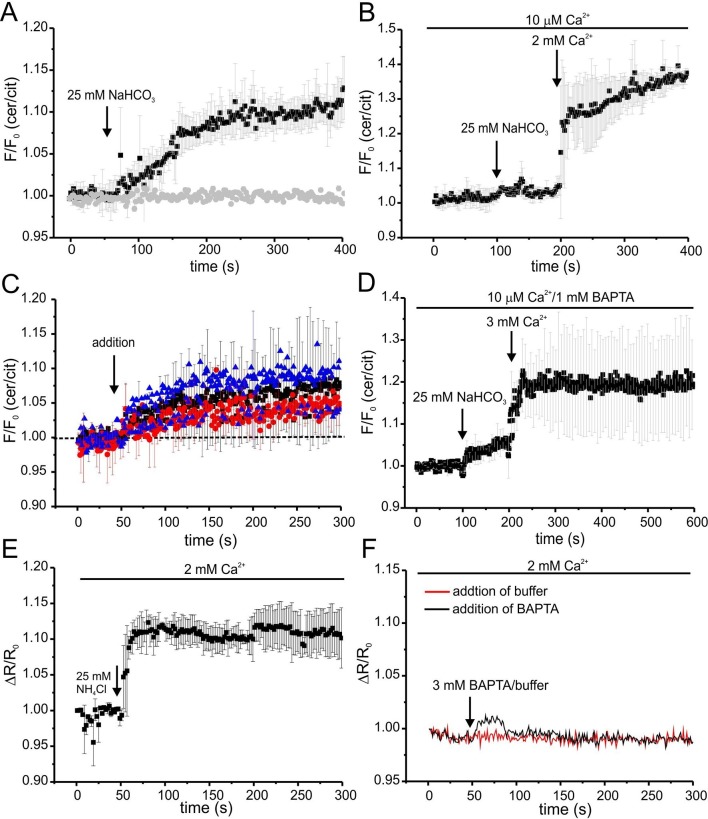
Figure 7. Ca2+ regulation of cAMP dynamics in sperm.
(A) Changes in FRET after stimulation of mlCNBD-FRET sperm with 25 mM bicarbonate. Sperm have been either kept in 2 mM (black) or 10 μM (grey) Ca2+ buffer. FRET has been measured using a spectrofluorometer; n = 3 for each condition. (B) Changes in FRET after stimulation of a mlCNBD-FRET sperm kept 10 μM Ca2+ buffer with 25 mM bicarbonate, followed by addition of 2 mM Ca2+ (final concentration); n = 3. (C) Changes in FRET of mlCNBD-FRET sperm kept in 2 mM Ca2+ buffer after the addition of 2 mM BAPTA (final: 20 μM Ca2+, black), kept in 10 μM Ca2+ buffer after the addition of 1 mM BAPTA (final: 2.2 nM Ca2+, red), or kept in 2 mM Ca2+ buffer after the addition of 3 mM BAPTA (final: 443 nM Ca2+, blue). Arrow indicates the addition of Ca2+or BAPTA, the dotted line indicates the baseline; n = 4 for each condition. (D) Changes in FRET of mlCNBD-FRET sperm kept in 10 μM Ca2+/1 mM BAPTA after addition of bicarbonate followed by 3 mM Ca2+ (final: 2 mM Ca2+). Data is shown as mean ± S.D; n = 4. (E) Changes in pHi of wild-type sperm kept in 2 mM Ca2+ buffer after addition of 25 mM NH4Cl. Data is shown as mean ± S.D.; n = 3. (F) Changes in pHi of wild-type sperm kept in 2 mM Ca2+ buffer after addition of 3 mM BAPTA (final: 443 nM Ca2+, black) or buffer (red) as a control. Data represents the mean of n = 3.

