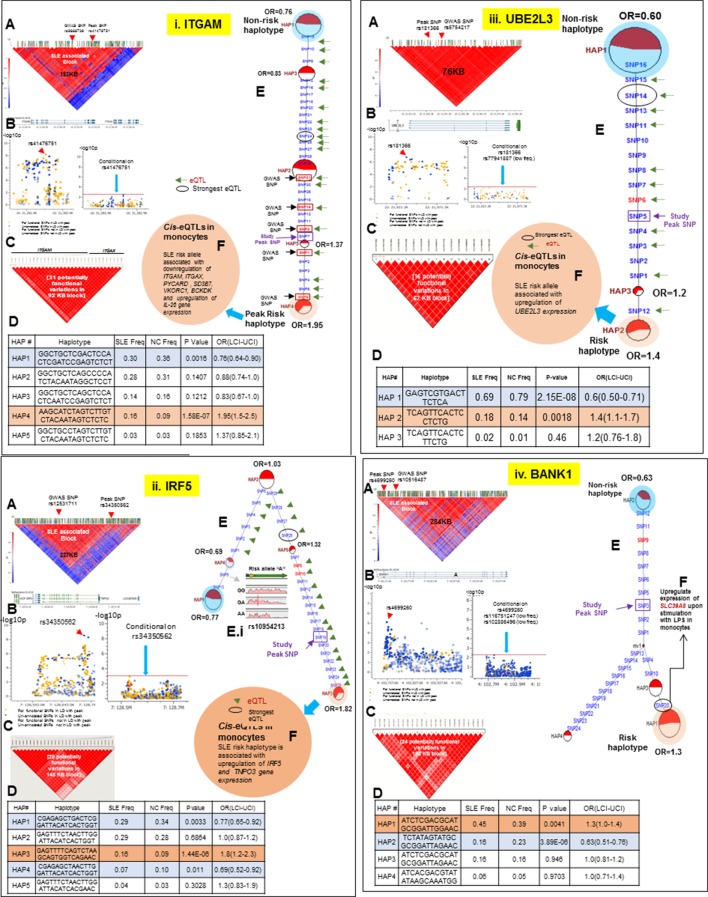
Figure 10. LD structure, haplotypes and MJ network analysis of ITGAM, IRF5, UBE2L3 and BANK1.
Panel 10 (i) shows ITGAM, Panel 10 (ii) shows IRF5, Panel 10 (iii) shows UBE2L3 and Panel 10 (iv) shows BANK1 genetic association analysis. (A) LD structure of studied intervals generated with common (MAF≥10%) variants in 1349 samples, 221 in case of ITGAM, 400 in case of IRF5, 84 in case of UBE2L3 and 430 variants in case of BANK1. (B) Zoom Manhattan plot of all common variants in studied region showing SLE association levels and conditional analysis on peak SNP/s. (C) LD block based on potentially functional SLE associated SNPs which are used for downstream haplotype analysis. (D) Haploview generated haplotypes from functional variants. Frequencies in cases and controls and association statistics are provided. Risk (red) and protective (blue) haplotypes are color highlighted. (E) MJ networks analysis to illustrate divergence of risk and protective regulatory haplotypes. Haplotype with significant p value (p<0.05) are highlighted with red (risk) and blue (non-risk) color. Study peak SNP, previously known SLE GWAS tag SNP and eQTLs are indicated with arrows. (F) eQTL variations from public databases for variants in strongest risk haplotype.

