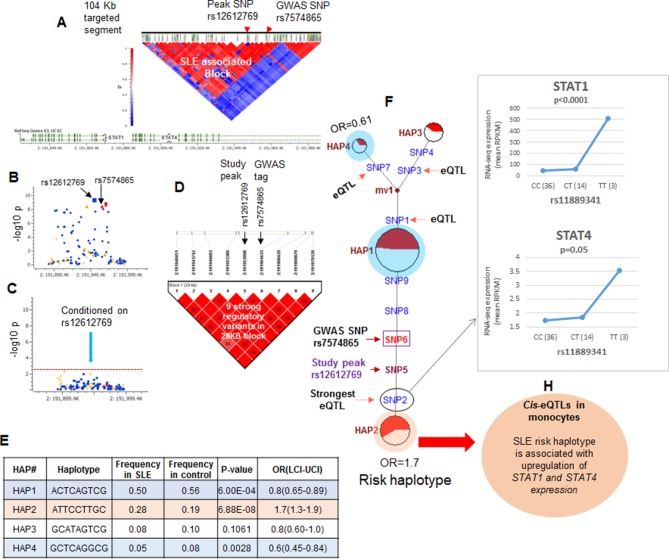
Figure 4. LD structure, haplotypes and MJ networks analysis at STAT4 locus.
(A) LD structure of STAT4 sequenced segment is shown above molecular map of the genomic segment showing STAT1 and STAT4 exon structure. The locations of GWAS tagging SNPs are shown above LD plot, which was produced with 104 markers (MAF≥10%) in 1349 Caucasians. (B) Zoom in Manhattan plot showing SLE association levels of individual sequence variants in STAT4 LD block containing STAT4 tagging SNPs. Yellow points indicate functional variants, blue points indicate un-annotated variants and red points identify GWAS and study peak tagging SNPs. (C) Conditional analysis on peak SNP rs12612769 removes all significant associations with SLE within the LD block. (D) LD block based on nine potentially functional SLE associated variants used for haplotype analysis. (E) Derived haplotypes with SLE association results. (F) Median-joining (MJ) network analysis of STAT4 haplotypes. Spheres (termed nodes) represent the locations of each haplotype (from table in E) within the network and the size of the node is proportional to the overall frequency of that haplotype in the dataset. Each node is overlaid with a pie chart that reflects the frequency of that haplotype in cases (red) versus controls (white). The lines connecting the nodes are labeled with the variants that distinguish the connected nodes and the length is proportional to the number of variants. Haplotypes with significant (p<0.05) association with SLE are highlighted with red (risk) and blue (non-risk). Study peak SNP, SLE GWAS tag SNP and eQTLs are indicated with arrows, boxes and circles within their locations within the network. (G) Presents cis-eQTL effects observed with SNP2 on STAT1 and STAT4 in macrophage RNAseq analysis. (H) Similar eQTL effects observed in published eQTL databases in literature.

