. 2016 Mar 22;5:e12613. doi: 10.7554/eLife.12613

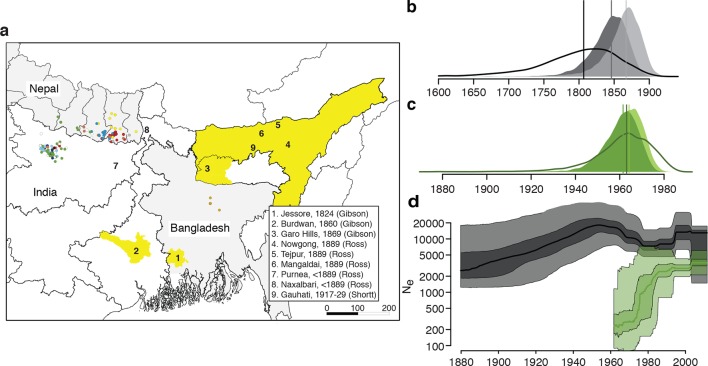
Figure 1. History and geography of Indian subcontinent L. donovani.

(a) Location of the patients from which the 204 L. donovani genomes were isolated, and of historical Kala-Azar outbreaks. Genetic groups of the parasite isolates are indicated by the colour of the dots representing them, matching those in Figure 2a,c. Sampling dates and locations are summarised in Figure 1—figure supplement 1, and detailed information about each strain including GPS coordinates are given in the source data file. Citations are to historical primary literature reviewed and cited in (Gibson, 1983). Posterior probability distributions of estimated ages for the oldest split in (b) the main population in Bihar and Nepal and (c) the ISC5 group associated with Sb resistance. Dark shading shows estimates under a strict molecular clock, light shading from relaxed molecular clock and lines show relaxed clock results with Bangladeshi and putative hybrid isolates included. (d) Estimated effective population size through time for ISC5 population (green) and the rest of the parasite population (black/grey). Lines show median of posterior distributions, dark and light shading cover 50% and 95% of the posterior density respectively. Dates for all splits on this phylogeny and other results of phylogeographic analysis are shown in Figure 1—figure supplement 2.

DOI: http://dx.doi.org/10.7554/eLife.12613.003

Figure 1.

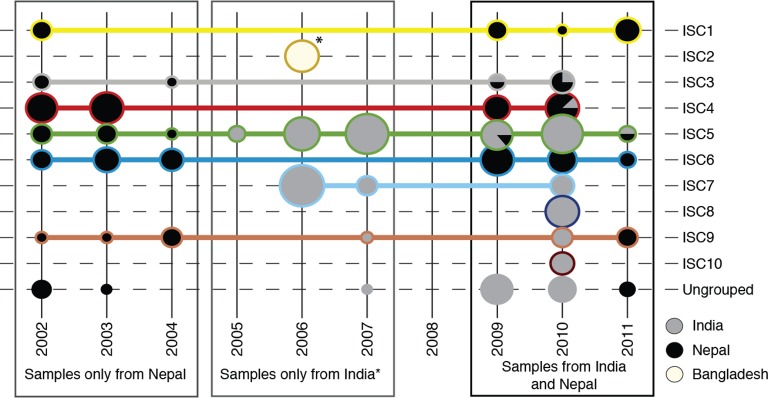
Figure 1—figure supplement 1. Sampling of genetic groups.

Figure 1—figure supplement 1.

Pie charts indicate the number of samples in each year (columns), for each genetic group (rows) coming from each country (grey shading). Horizontal lines connect and surround isolates of each group, with colours matching the groups shown in panels (b) and (c). *8 samples from Bangladesh were all sampled in 2006, and form a distinct population to Nepalese and Indian isolates (ISC2).

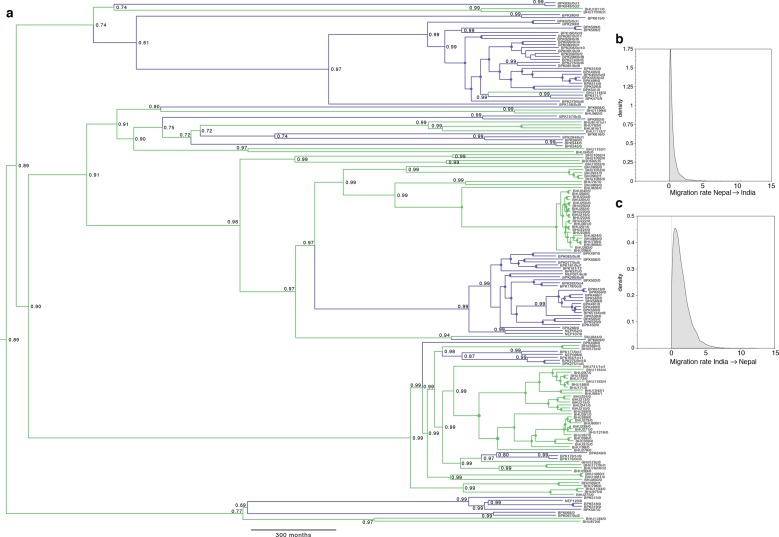
Figure 1—figure supplement 2. Full results of discrete-space, constant population size molecular clock Bayesian phylogeography analysis of core population.

Figure 1—figure supplement 2.

(a) Maximum posterior probability phylogeny, with tips coloured by country of origin for sample (green for India, blue for Nepal), and branches coloured by maximum posterior probability of country reconstructed in discrete phylogeography model. Values on nodes indicate posterior probability of assigned country/colour, with filled circles marking nodes with probability 1. Other panels represent posterior probability distributions for rates of migration (lineage switches per month) from (b) Nepal to India and (c) from India to Nepal. Note the mode (maximum posterior probability estimate) for migration from Nepal is zero, but non-zero migration in the reverse direction is supported.