. 2016 Mar 22;5:e12613. doi: 10.7554/eLife.12613

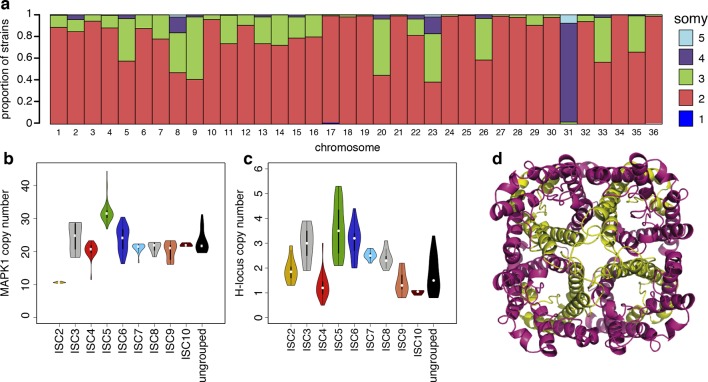
Figure 3. Structural variations in ISC L. donovani.

(a) Stacked barplots per chromosome showing the proportion of ISC strains that are monosomic, disomic, trisomic, tretrasomic or pentasomic for the respective chromosome. A full breakdown of somy per strain is presented in Figure 3—figure supplement 3, and a complete catalogue of other structural variants in Figure 3—figure supplement 1. Violin plots showing the copy number of MAPK1 (b) and H-locus (c) per ISC group, except for ISC1 where these amplicons were absent. These amplicons are intra-chromosomal (Figure 3—figure supplement 2). (d) Tetrameric protein model of the transport protein aquaglyceroporin-1. The C-terminus part that is affected by the 2-nucleotide frameshift found in all ISC5 isolates is shown in magenta. Image was created using PyMOL version 1.50.04 (Schrödinger).

DOI: http://dx.doi.org/10.7554/eLife.12613.011

Figure 3.

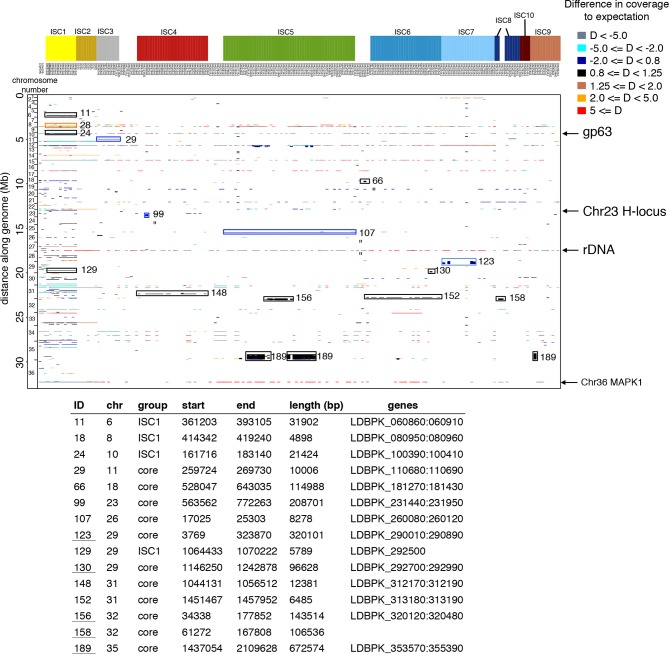
Figure 3—figure supplement 1. Copy number variants in all 206 genomes.

Figure 3—figure supplement 1.

The position in the genome is shown on the y-axis, while individual isolates are shown on the x-axis. Colours of each copy number variant (CNV) represent the haploid depth variation (D) compared to the median depth for that chromosome (see legend for colour key). When the depth of the majority of the strains is high like the episome in ch23, this appears as a reduced depth in the strains that lack the episome. The length of each CNV is reflected by its length along the y-axis (i.e. thickness of the line). Four major CNVs – gp63, rDNA, an episome in ch23 and the MAPK amplification – are indicated with arrows. Group-specific copy number variants were highlighted with a box and numbered – detailed information about these CNVs are given in the table. The 206 samples included here are 204 ISC samples with L. infantum JPCM5 (MCAN/ES/1998/LLM-877) and L. donovani LV9 (MHOM/ET/1967/HU3) for reference.

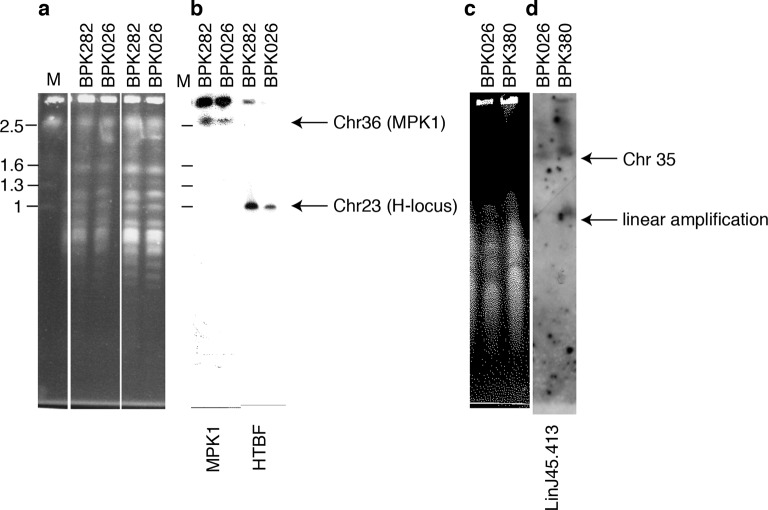
Figure 3—figure supplement 2. Copy number variation by intrachromosomal tandem duplication or extrachromosomal linear amplification in clinical isolate.

Figure 3—figure supplement 2.

(a, c) Chromosomes from L. donovani BPK282/0cl4 (ISC6), BPK380/0 (ISC9) and BPK026/0cl5 (ISC1) were separated by pulsed-field gel electrophoresis (PFGE). (b) The MAPK1-locus and H-locus were detected by southern blot hybridization with probes specific for MAPK1 or HTBF, respectively. Hybridization was only observed in fragments of lengths equal to those of chr36 (~2.5 Mb) and chr23 (~1 Mb) and no additional smaller fragments were observed, indicating the absence of extra-chromosomal amplifications. (d) In contrast, linear extrachromosomal amplification (as evidenced by a second and smaller band) is shown for chromosome 35 in BPK380/0 by hybridization of a probe specific to the LinJ35.4130 gene.

Figure 3—figure supplement 3. Chromosome number variation in L. donovani in the ISC.

Figure 3—figure supplement 3.

Average number of chromosomes found within each cell culture for each of the 36 chromosomes (y-axis) and each of the 204 L. donovani strains (x-axis). Samples are coloured by population assignment following Figure 1c, with strains not clustered in the main populations shown in white.