
Figure 3. Univariate whole-brain results.
Temporal demands of cognitive control produced a gradient of activation along the rostral/caudal axis of the LPFC. Temporal Control activated the rostral LPFC (red), Contextual Control the mid LPFC (green), and the interaction relating to Feature Control the caudal LPFC (blue). All results are corrected for multiple comparisons. Darker colors: p<10–3; Brighter colors: p<10–8 (Temporal Control, Feature Control) or p<10–12 (Contextual Control) to better visualize peaks.
DOI: http://dx.doi.org/10.7554/eLife.12112.006
Figure 3—source data 1. Statistical parametric maps of the univariate whole-brain results.
Maps contain t-statistics and have been thresholded to correct for multiple comparisons as detailed in the Materials and methods.
elife-12112-fig3-data1.zip (112.1KB, zip)
DOI: 10.7554/eLife.12112.007
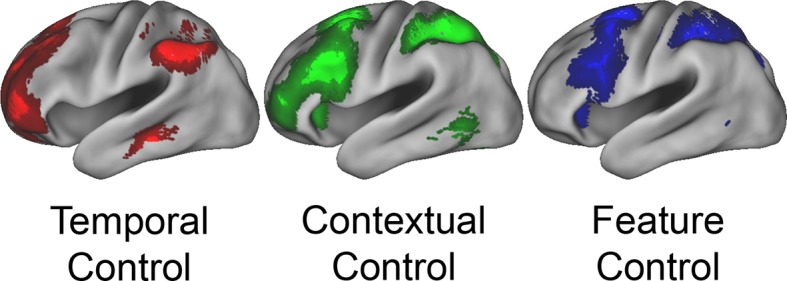
Figure 3—figure supplement 1. Univariate whole-brain results of Stimulus Domain.
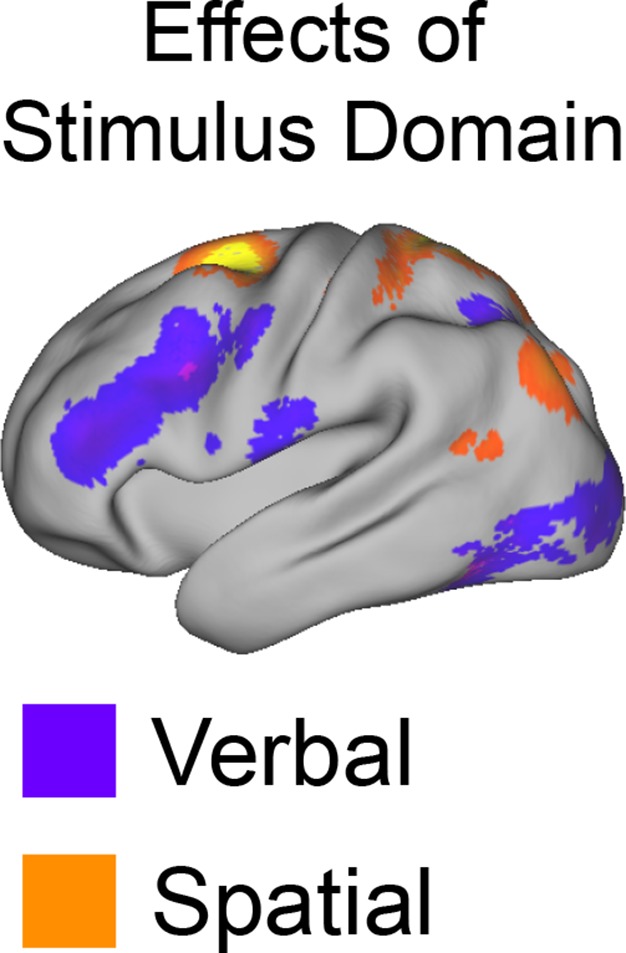
Demands on Stimulus Domain produced differences along the dorsal/ventral axis of the LPFC. Effects of verbal processing (verbal > spatial; purple) were observed in the ventral LPFC, while effects of spatial processing (spatial > verbal; orange) were observed in the dorsal LPFC.
Figure 3—figure supplement 2. Effects of delay and dual.
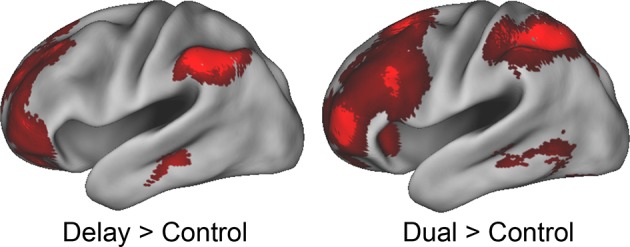
Despite being associated with the fastest reaction times and lowest error-rates, the Delay condition demonstrated activation in the rostral-most areas of the LPFC. These results indicate that the activations do not reflect difficulty, time-on-task, or attention. Conversely, the Dual condition demonstrated the slowest reactions times and highest error-rates, and produced convergent activations in the rostral-most areas of the LPFC. These results indicate that the activations do not reflect ease or 'default' activity.
Figure 3—figure supplement 3. Activation magnitudes within regions-of-interest.
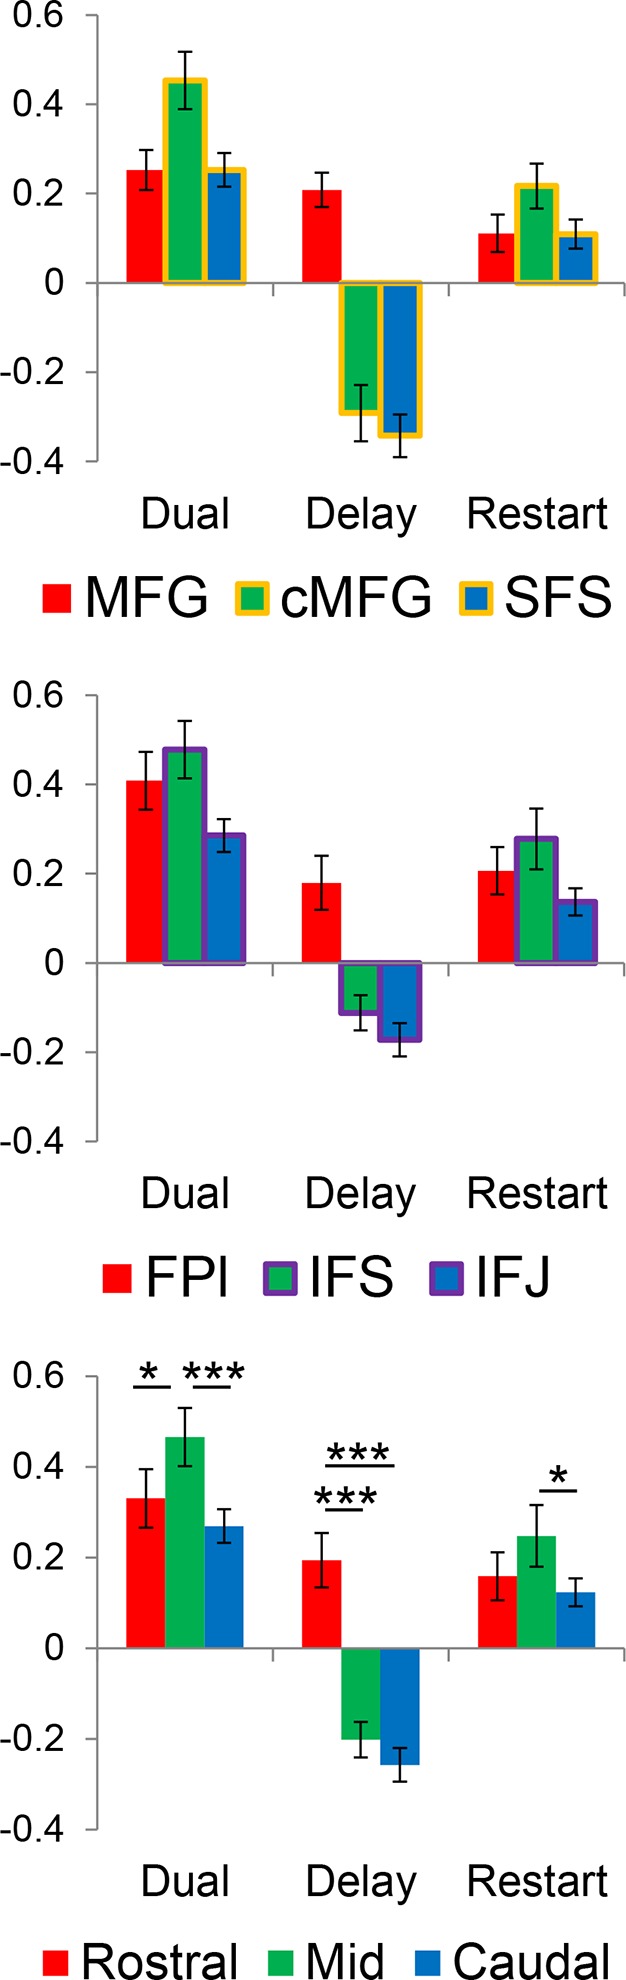
Bars represent contrasts of each cognitive control condition against the Control condition, collapsing across Stimulus Domain. Data were split to provide unbiased estimates of activation (see Materials and methods). Given the similar activation patterns between dorsal (MFG, cMFG, SFS) and ventral (FPl, IFS, IFJ) areas, data were averaged by rostral/caudal zone collapsing across the dorsal/ventral axis for statistical tests. *pcorrected<0.05; ***pcorrected<0.0005.
Figure 3—figure supplement 4. Gradient visualization.
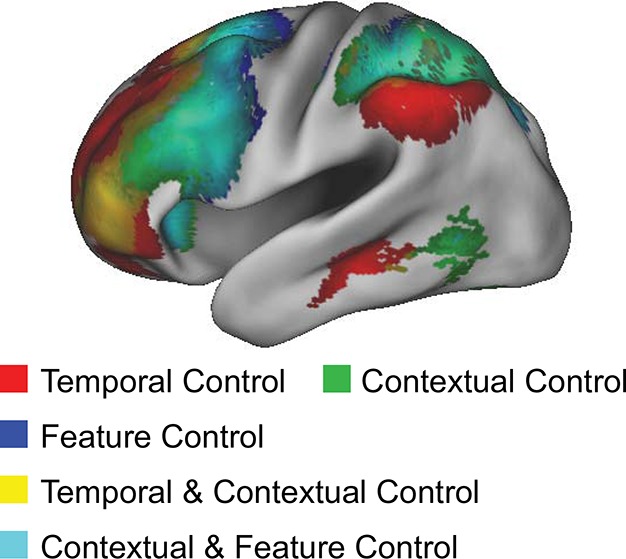
Contrasts of cognitive control overlaid to visualize the gradient and extent of LPFC coverage.
Figure 3—figure supplement 5. Univariate whole-brain robustness.
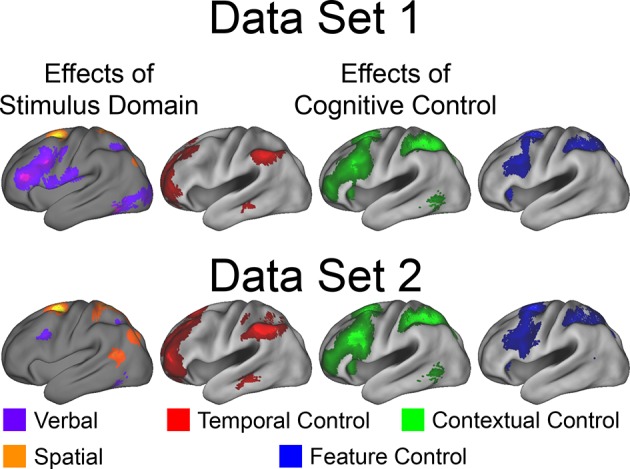
Data were split into two data sets through an alternating runs procedure. Whole-brain univariate contrasts were repeated for each data set and are depicted above. Details are otherwise identical to Figure 3 in the main text.