. 2016 Mar 21;5:e12112. doi: 10.7554/eLife.12112

Figure 8. LPFC dynamics and higher-level cognitive ability.

Neural metrics were based on modeled estimates of effective connectivity and their modulations (Figure 6). Metrics reflecting top-down LPFC modulations by cognitive control demands (top-down strength), and metrics reflecting bottom-up LPFC modulations by Stimulus Domain demands (bottom-up strength) were combined, respectively. (A) Top-down and bottom-up strength were anti-correlated. (B) Top-down strength predicted trait-measured higher-level cognitive capacity. (C) By contrast, bottom-up strength did not correlate with higher-level cognitive capacity. (D) Hierarchical strength reflected the degree to which mid LPFC showed greater outward than inward fixed connectivity. This metric was also positively related to higher-level cognitive capacity. *p<0.05; **p<0.005.

DOI: http://dx.doi.org/10.7554/eLife.12112.027

Figure 8.

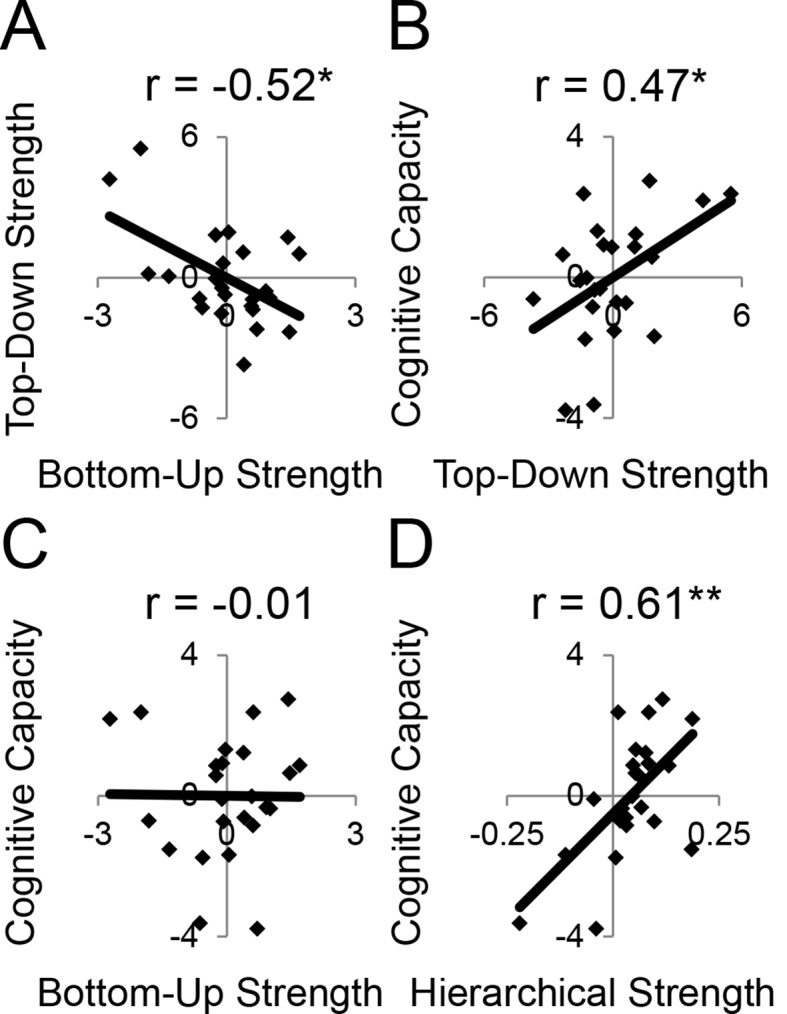
Figure 8—figure supplement 1. Model and trait correlations and covariances.

Figure 8—figure supplement 1.

(A) Correlations between top-down parameters. Individual differences in the magnitude of top-down modulations tended to be correlated. The negative correlations reflect anti-correlation between parameters that were positive and negative, thereby reflecting a positive co-variation in magnitude. (B) Model covariance matrix. Covariances between parameters for the model depicted in Figure 6. The matrix represents the average covariance matrix across participants. The covariances indicate weak relationships between parameters suggesting that inter-relationships between model parameters are not due to the model-fitting procedure. (C) Correlations between independent measures of cognitive ability. T – Temporal Control; C – Contextual Control; Letter – letter span; Spatial – spatial span; Oper – operation span; Symm – symmetry span; Raven – Raven’s Advanced Progressive Matrices.
Figure 8—figure supplement 2. Dynamic causal modeling derived individual difference measures.

Figure 8—figure supplement 2.

Top-down modulations resulting from Temporal Control (red) and Contextual Control (green) were combined using principle components analysis (PCA) to represent top-down strength. Bottom-up modulations resulting from Stimulus Domain (spatial – orange; verbal – purple) were similarly combined using PCA to represent bottom-up strength. The height of the vertex of a parabolic fit of efferent – afferent fixed connectivity by rostral/caudal location was used as a metric of the hierarchical strength of mid LPFC.
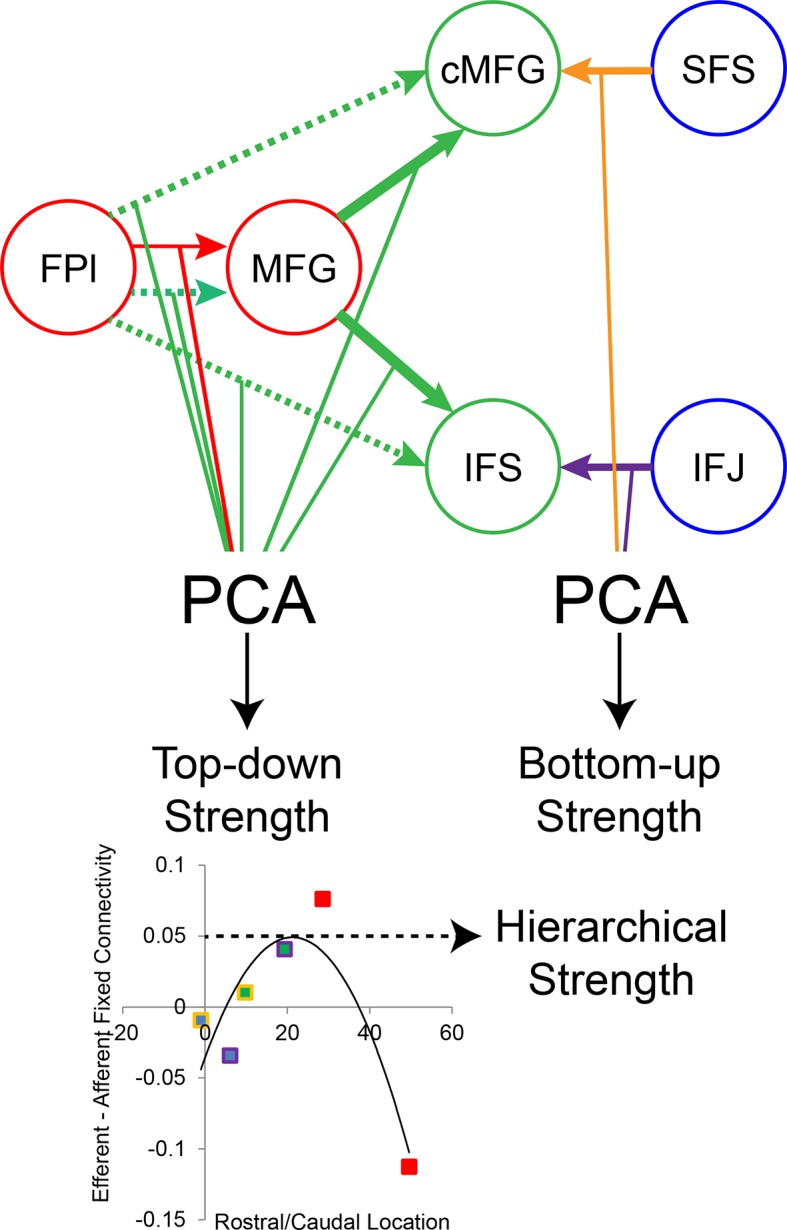
Figure 8—figure supplement 3. LPFC dynamics and higher-level cognitive ability robustness.

Figure 8—figure supplement 3.

Data were split into two data sets through an alternating runs procedure. Details are otherwise identical to Figure 8 in the main text.