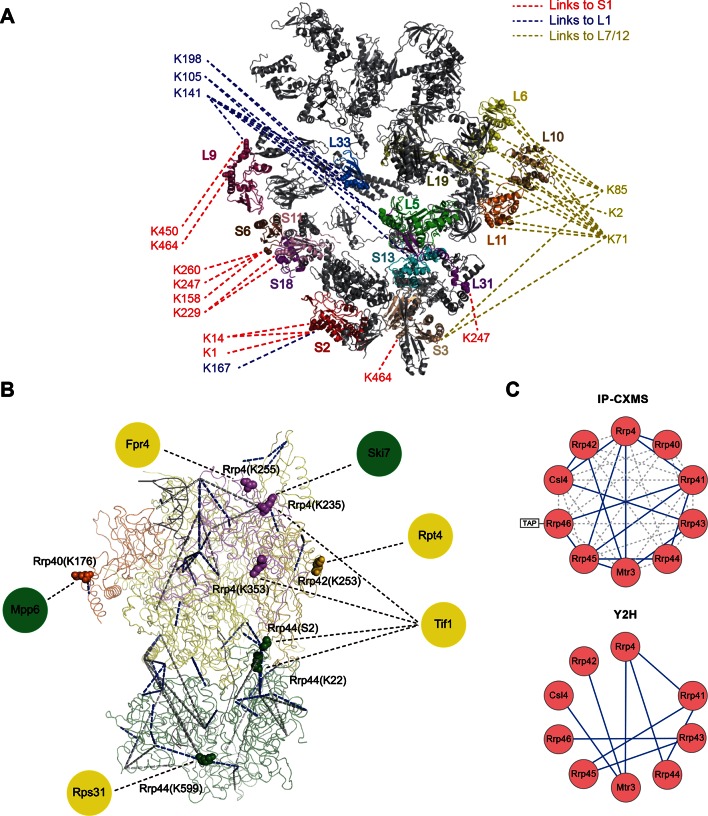
Figure 4. Leiker-based CXMS analyses of large protein assemblies.
(A) Analysis of a purified E. coli 70S ribosome revealed the locations of highly dynamic periphery ribosomal proteins S1, L1, and L7/12 that were refractory to crystallography and cryo-EM analysis. Cross-links to S1, L1, and L7/12 are colored red, blue, and yellow, respectively, and the cross-linked residues on these three proteins are numbered according to the Uniprot sequences. (B) Analysis of a crude immunoprecipitate of the yeast exosome complex. Dashed blue and grey lines denote 50 compatible and 22 incompatible cross-links, respectively, according to the structure of the RNA-bound 11-subunit exosome complex (PDB code: 4IFD). Rrp44, green; Rrp40, orange; Rrp4, violet; Rrp42, gold; other exosome subunits, yellow; RNA, black. Known and candidate exosome regulators revealed by Leiker-cross-links are shown along the periphery and highlighted in green and yellow circles, respectively. (C) Connectivity maps of the ten-subunit exosome core complex based on the inter-molecular cross-links identified in the current IP-CXMS experiments or on previous yeast two-hybrid (Y2H) studies (Stark et al., 2006; Uetz et al., 2000; Oliveira et al., 2002; Luz et al., 2007; Yu et al., 2008). Blue solid lines: experimentally identified putative direct protein-protein interactions; grey dashed lines: theoretical cross-links according to the crystal structure; Cα-Cα distance cutoff ≤30 Å.
DOI: http://dx.doi.org/10.7554/eLife.12509.015
Figure 4—figure supplement 1. Distance distribution of the inter-molecular and intra-molecular cross-links identified in 70S ribosomes.
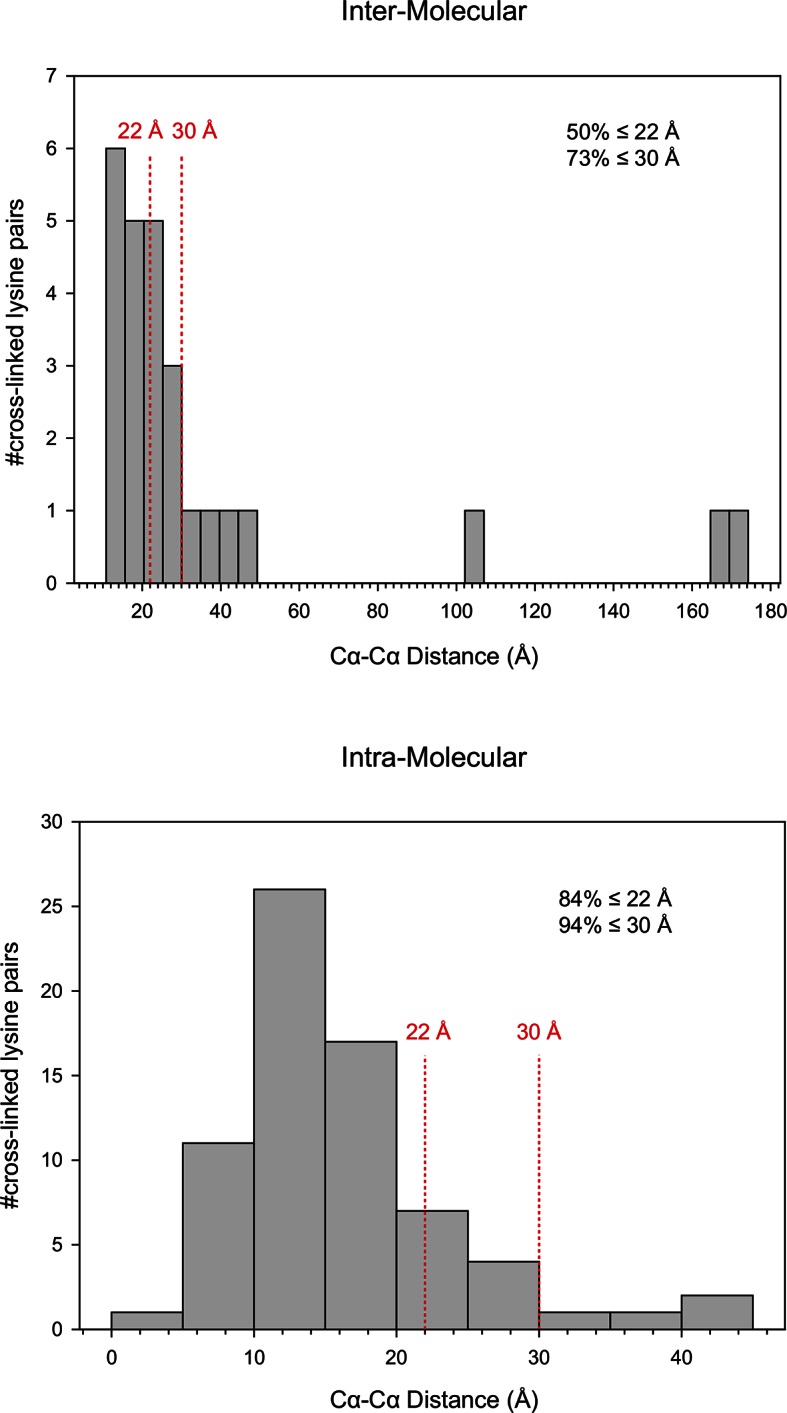
Figure 4—figure supplement 2. Alignment of L9 and L2 from the crystal structure (L9, orange; L2, wheat; PDB code: 2AW4) and their counterparts from the cryo-EM reconstruction (L9, blue; L2, lightblue; PDB code: 5AFI).
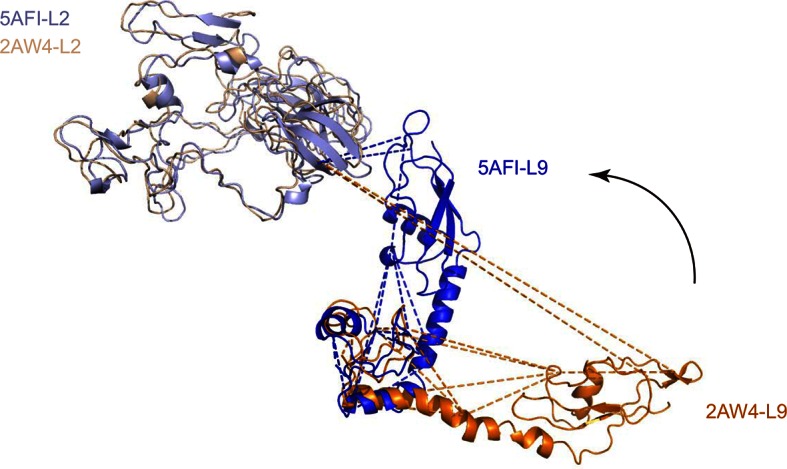
Figure 4—figure supplement 3. Negative staining of non-cross-linked E. coli 70S ribosome.
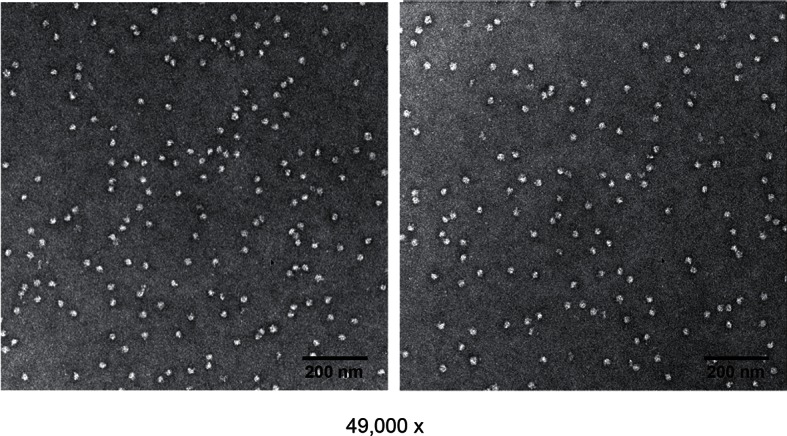
Figure 4—figure supplement 4. Connectivity maps of cross-links involving (A) S1, (B) L1, (C) L7/12, and (D) L31.
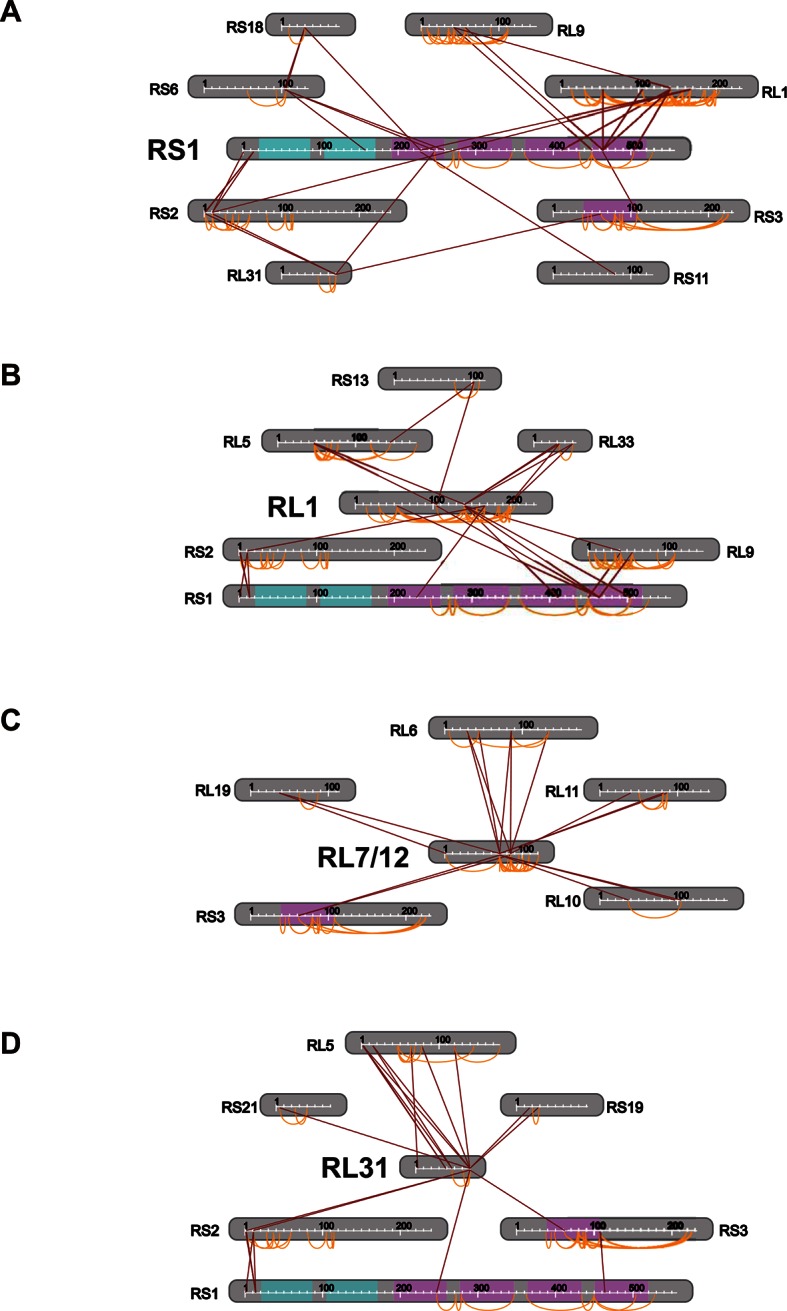
Figure 4—figure supplement 5. Silver-stained SDS-PAGE gel of the crude immunoprecipitate of TAP-tagged Rrp46.

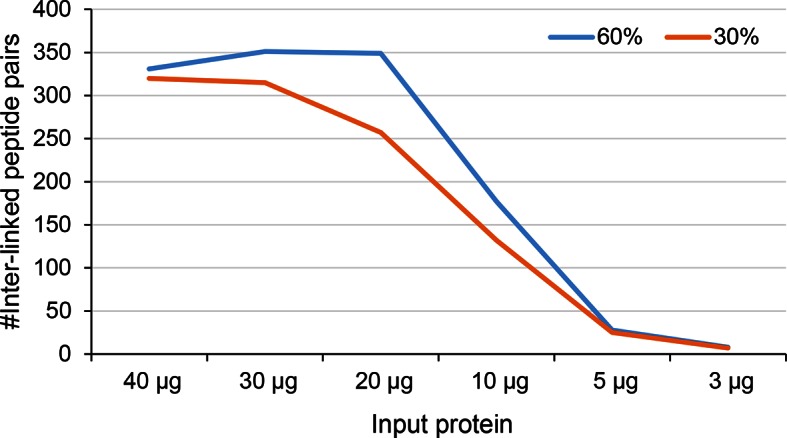
Figure 4—figure supplement 6. Number of identified inter-linked peptide pairs from decreasing amount of Leiker-cross-linked exosome immunoprecipitate (FDR < 0.05, E-value < 0.01).
