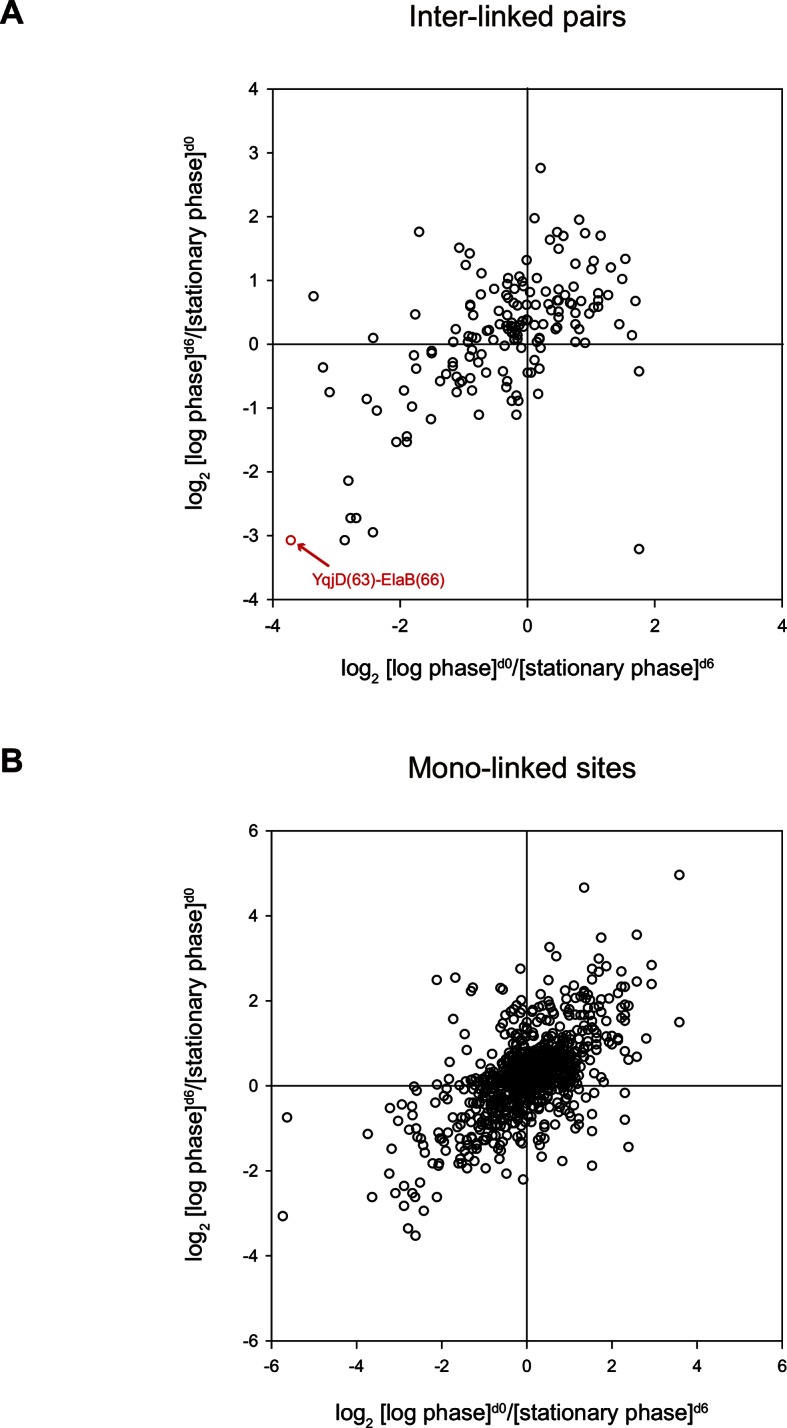
Figure 8. Quantitative CXMS analysis of E. coli lysates.

Abundance ratios of (A) inter-linked lysine pairs and (B) mono-linked sites in the forward ([log phase]d0/[stationary phase]d6) and the reverse labeling experiment ([log phase]d6/[stationary phase]d0).
DOI: http://dx.doi.org/10.7554/eLife.12509.038
