
Figure 3.
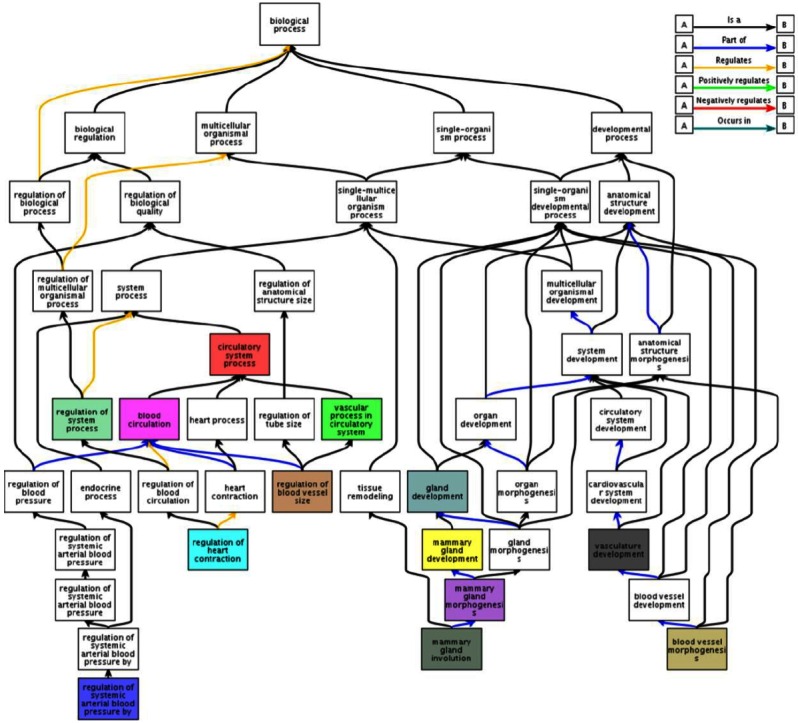
The ancestor chart of the significantly detected biological process from DAVID analysis. Of significantly observed gene ontology (GO) terms, blood circulation and gland development related terms were visualized as ancestor chart using QuickGO. Each box represents GO term and colored boxes are significantly observed terms in the DAVID gene-set analysis.