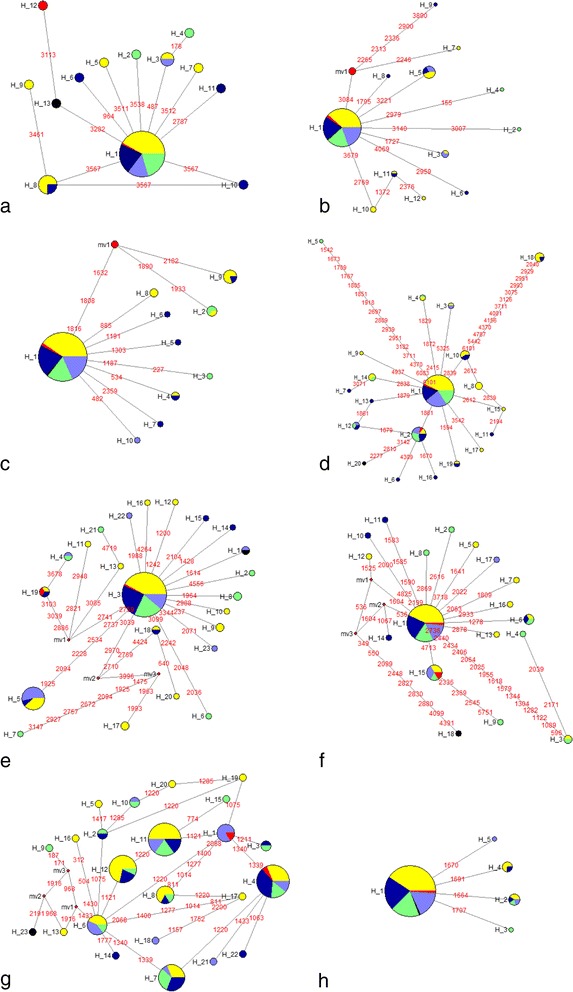
Fig. 2.

Haplotype networks of eight HKT transporter genes including (a) HKT1;1 (b) HKT1;2 (c) HKT1;3 (d) HKT1;4 (e) HKT1;5 (f) HKT2;1 (g) HKT2;3 (h) HKT2;4. Each circle represents a haplotype and size of each circle is proportional to haplotype (allele) frequency. Colour coding represents phenotype class based on standard evaluation system (SES) score. (Red-highly tolerant, Purple-tolerant, Green moderately tolerant, Blue-Sensitive, Yellow-highly sensitive)
