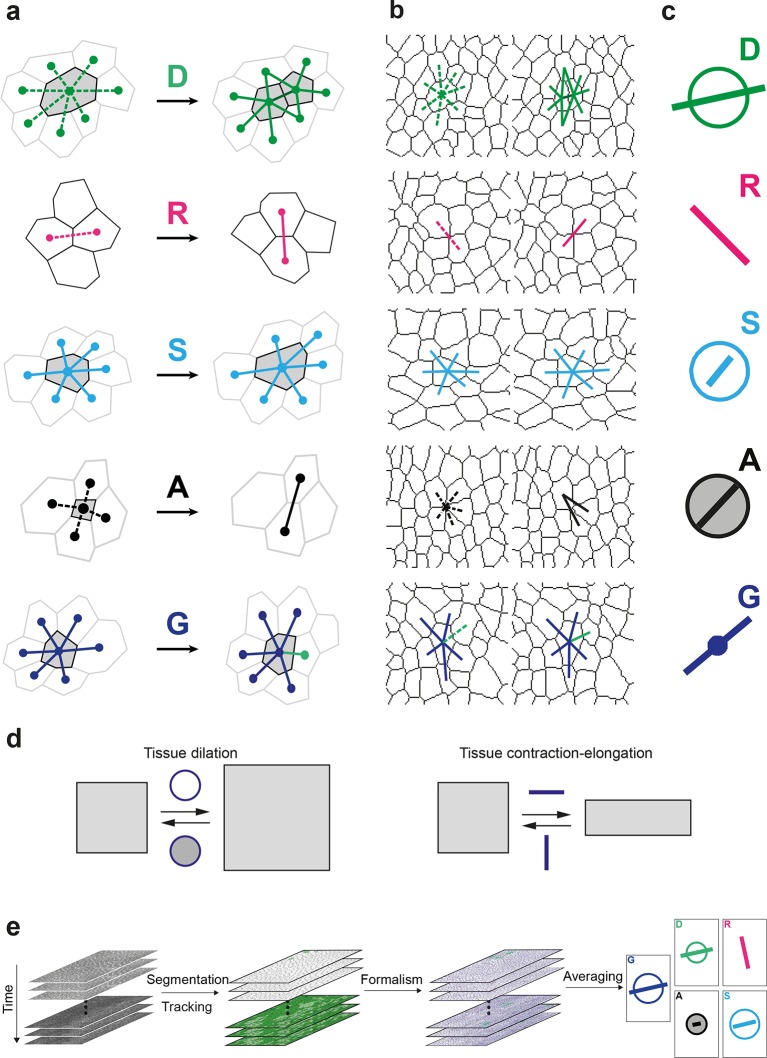
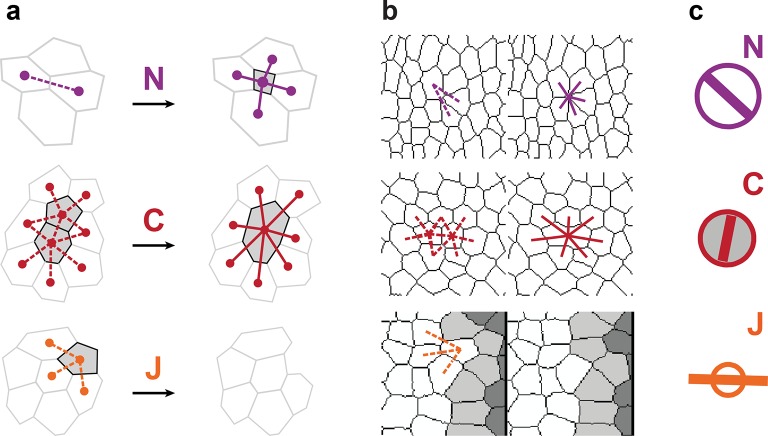
Figure 1. Definitions of the main formalism quantities and analysis workflow.
(a) Characterizations of the four main elementary cell processes and of tissue deformation: divisions (green; and dark green for the link created between the daughter cells); , rearrangements (magenta); , size and shape changes (cyan); , apoptosis/delaminations (black). They are defined and measured from the rates of changes in length, direction and number of cell-cell links, here on two schematized successive images. They make up the tissue deformation rate , the measurement of which is based on geometric changes of conserved links (dark blue links) excluding non-conserved links (green). Dots indicate cell centroids. Lines are links between neighbor cell centroids. Dashes are links on the first image (left) which are no longer present on the second one (right). Some cells are hatched in grey to facilitate the comparison. (b) Measurements of the four elementary main cell processes rates and of tissue deformation rate. Same as (a), this time showing cell-cell links on two actual successive segmented images extracted from experimental time-lapse movies. (c) Representation with circles and bars of the quantitative measurements performed on (b) of the deformation rates explained in (d). (d) Deformation rate: a deformation quantifies a relative change in tissue dimensions: it is expressed without unit, e.g. as percents. A deformation rate is thus expressed as the inverse of a time, e.g. 10-2 h-1 represents a 1% change in dimension within one hour. It can be decomposed into two parts. First (left): an isotropic part that relates to local changes in size. The isotropic part can either be positive or negative, reflecting a local isotropic growth or shrinkage of the tissue. The rate of dilation is represented by a circle, the diameter of which scales with the magnitude of the rate. Positive and negative dilations are represented by circles filled with white and grey, respectively. Second (right): an anisotropic part that relates to local changes in shape. The anisotropic part of the deformation rate quantifies the local contraction-elongation or convergence-extension (CE) without change in size. It can be represented by a bar in the direction of the elongation, the length and direction of which quantify the magnitude and the orientation of the elongation. (e) Workflow used to quantify tissue development. Image analysis leads to characterization of cell contours (segmentation), and lineages (tracking) in the case of movies. Our formalism yields an identification of each cell-level process and its description in terms of cell-cell links (see a–b) and a quantitative measurement of their associated deformation rate (see c–d). Averaging over time, space and/or movies of different animals yields a map of each quantity in each region of space at each time with a good signal-to-noise ratio (see Videos 1, 4, 5).


