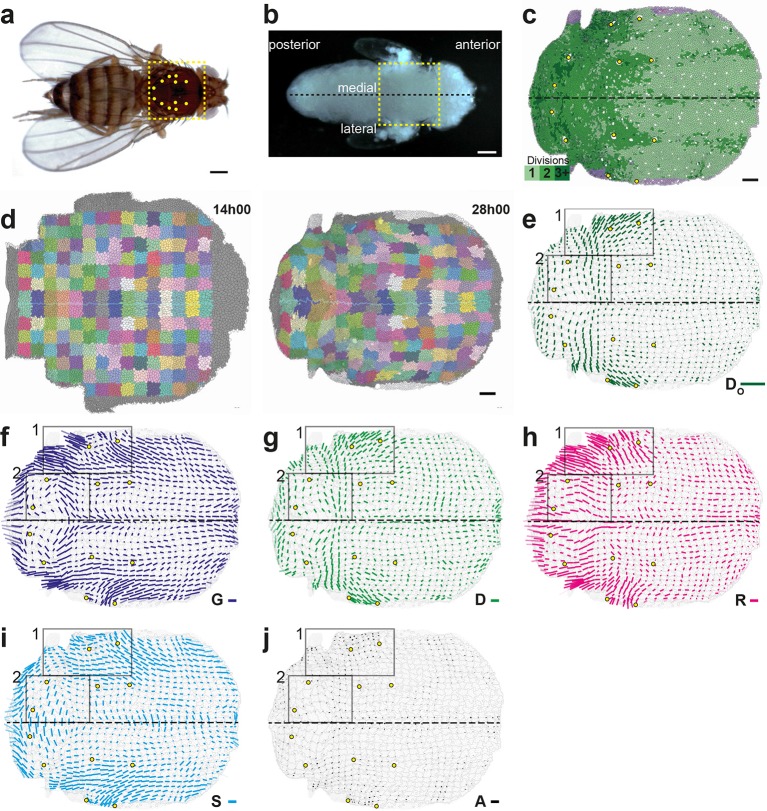
Figure 3. Quantitative characterization of tissue morphogenesis of the whole Drosophila notum.
(a) Drosophila adult fly. Yellow dotted box is the notum, circles filled in yellow are macrochaetae. (b) Drosophila pupa. Yellow dotted box is the region that was filmed. Black dotted line is the midline (along the anterio-posterior direction, mirror symmetry line for the medial-lateral axis). (c) Rate of cell divisions obtained from cell tracking. Number of cell divisions color-coded on the last image of the movie (28 hAPF), light green cell: one division; medium green cell: two divisions; dark green cells: three divisions and more; purple cells: cells entering the field of view during the movie. Circles filled in yellow indicate macrochaetae. The other white cells are microchaetae. (d) Growth and morphogenesis of cell patches during notum development. (Left) Cell contours (thin grey outlines) at 14 hAPF. A grid made of square regions of 40 μm sides was overlayed on the notum to define patches of cells whose centers initially lied withing each region (∼30 cells per patch in the initial image). Within each patch, all cells (and their future offspring) were assigned a given color. The assignement of patch colors was arbitrary but nevertheless respected the symmetry with respect to the midline (in cyan) to make easier the pairwise comparison of patches. Each patch was then tracked as it deformed over time to visualize tissue deformations at the patch scale. (Right) Cell contours at 28 hAPF. The variety of patch shapes reveals the heterogeneity of deformations at the tissue scale, as well as their striking symmetry with respect to the midline. (e) Map of average cell division orientation (bar direction) and anisotropy (bar length), (Appendix C.3.2). Its determination is solely based on the links between newly appeared sister cells (link in dark green in Figure 1a,b). (f–j) Maps of orientation (bar direction) and anisotropy (bar length) of CE rates, for (f) the tissue (compare the bar amplitude and orientation pattern with the pattern of patches in (d) right), (g) cell divisions , (h) cell rearrangements , (i) cell shape changes and (j) delaminations . In this Figure (and Figure 3—figure supplements 1 and 2), measurements over the whole notum have been averaged over 14 h of development (between 14 and 28 hAPF) and plotted on the last image of the movie (for their time-evolution see Video 4); contours of cells (thin grey outlines) and of initially square patches (thick grey outlines); black boxes outline the posterior regions (medial and lateral) described in the text; patches near the tissue boundary contain less data and are plotted accordingly with higher transparency; circles filled in yellow indicate macrochaetae; dashed black line is the midline. Scale bars: (a,b) 250 μm, (c,d) 50 μm, (e–j) 2 10-2 h-1.


