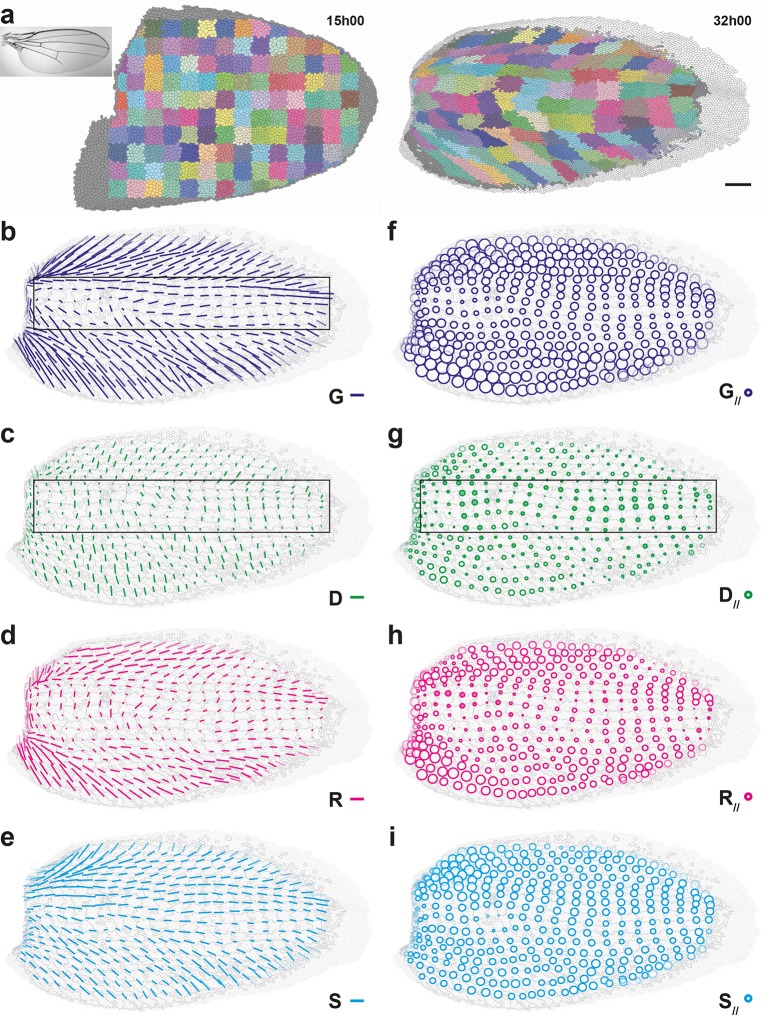
Figure 5. Quantitative characterization of pupal wing morphogenesis.
(a) Growth and morphogenesis of cell patches during wing development. (Left) Cell contours (thin grey outlines) at 15 hAPF. A grid made of square regions of 34 μm side was overlayed on the wing, to define patches of cells whose centers initially lied withing each region (∼30 cells per patch in the initial image). Within each patch, all cells (and their offspring) were assigned the same arbitrary color. Each patch was then tracked as it deformed over time to visualize tissue deformations at the patch scale. Inset: Drosophila adult wing. (Right) Cell contours at 32 hAPF. In this tissue as well, the variety of patch shapes reveals the heterogeneity of deformations at the tissue scale. (b–i) Average maps of main cell process CE rates (b–e) and of their components along tissue CE rate (f–i) for the CE rates of the tissue (, dark blue, b,f), cell divisions (, green, c,g), cell rearrangements (, magenta, d,h) and cell shape changes (, cyan, e,i). Black rectangular box in (b,c,g) outlines the region described in the text. Time averages were performed between 15 and 32 hAPF. A local transparency is applied to weight the CE rate according to the number of cells in each group of cells. Scale bars: (a) 50 μm, (b–e) 0.1 h-1; scale circle area (f–i) 0.1 h-1.


