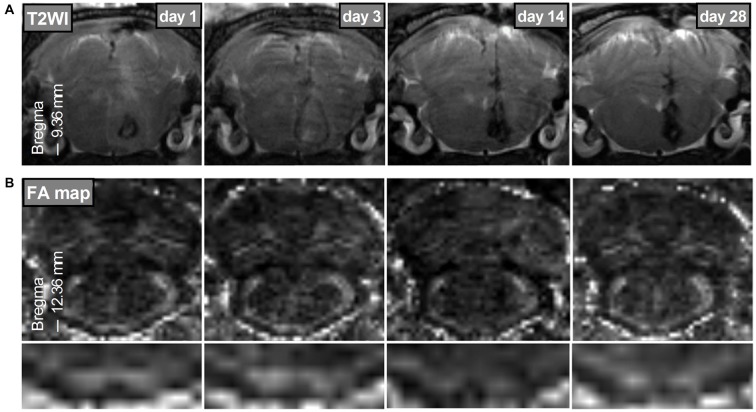
Figure 2.
Bilateral PYs degeneration after brain stem hemorrhage (BSH). (A) T2-weighted images of the hematoma on days 1, 3, 14, and 28 after BSH. (B) FA maps of the bilateral PYs caudal to the hematoma (–12.36 mm of bregma) on days 1, 3, 14, and 28 after BSH. The bottom images are the enlarged FA maps of the bilateral PYs.

