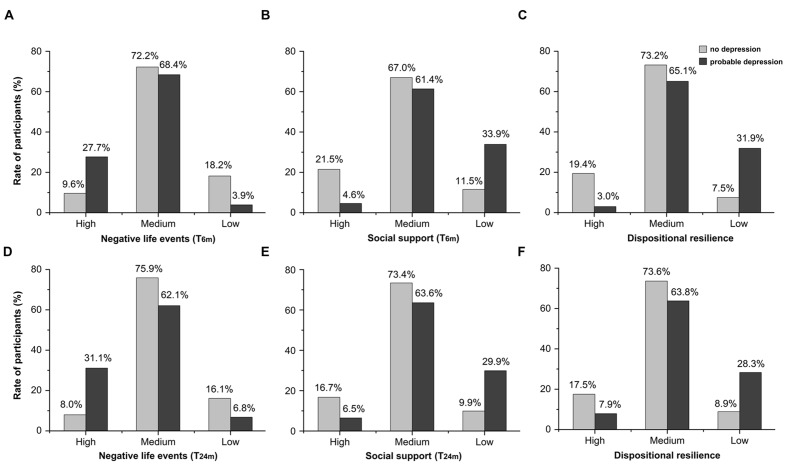
FIGURE 1.
(A–C): the rates of participants at T6m according to depressive symptoms (probable depression and no depression) and different groups (high group, medium group and low group) on negative life events (T6m), social support (T6m), and dispositional resilience. (D–F): the rates of participants at T30m according to depressive symptoms (probable depression and no depression) and different groups (high group, medium group, and low group) on negative life events (T24m), social support (T24m), and dispositional resilience.

