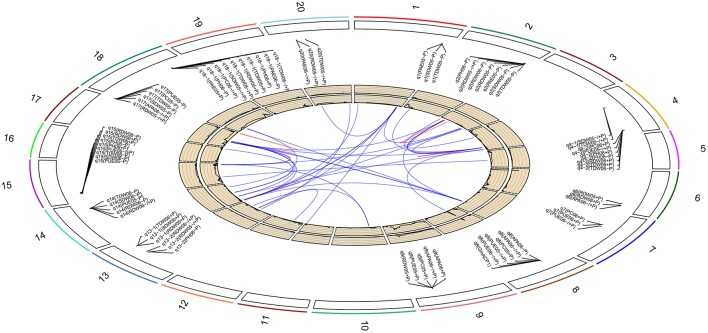
Figure 2.
Soybean chromosomes and main QTLs for investigated traits under high-P (+P), low-P (−P) conditions and the relative value (−∕+P). The lines link denotes epistatic associations between QTL and QTL. Blue line denotes two QTLs in different chromosomes, while red line denotes two QTLs in the same chromosome. The outside/inside wheat-colored circle indicates the LOD/R2 value curve for acid phosphatase activity at −∕+P in 2006, respectively. The outermost circle indicates the 20 soybean chromosomes, main QTLs for investigated traits under high-P (+P), low-P (−P) conditions and the relative value (−∕+P) and the position of these QTLs on the chromosomes.

