
Figure 4.
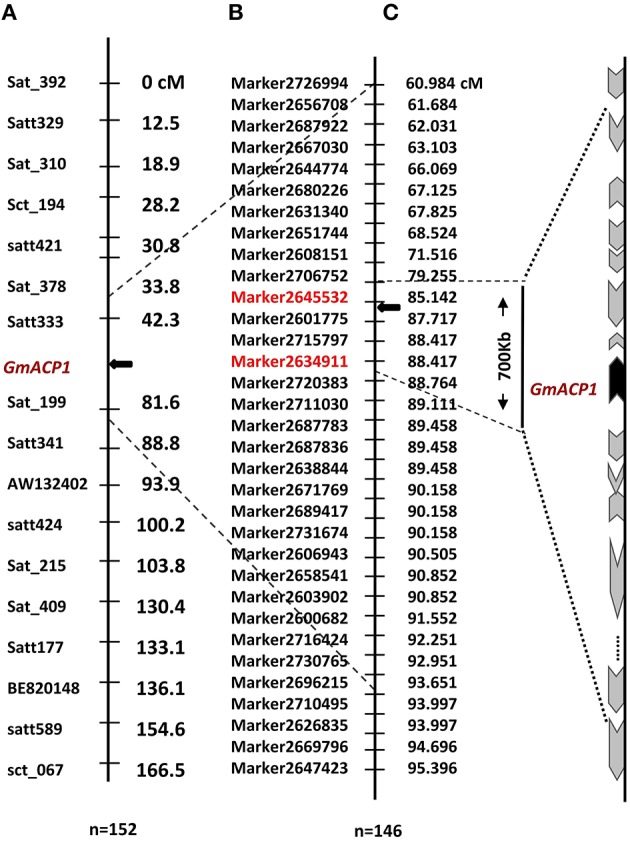
Distribution of tightly linked markers and plausible P efficiency-related genes on chromosome 8 of soybean. (A) A P efficiency-related QTL was mapped to the interval between markers Satt333 and Sat_199 on soybean chromosome 8. Left side of the chromosome denotes the marker names and right is the genetic distance (cM). (B) This QTL was further delimited to a 700 kb region on chromosome 8 using the present high-density genetic map and the same RIL population. Left side of the chromosome denotes marker names and the right is the genetic distance (cM). (C) The black arrow indicates the site of the predicted gene between Marker2634911 and Marker2645532 with lengths ranging from 85.1 to 88.4 cM. The black arrow denotes the position of an anchor gene (GmACP1), gray arrows denote the genes that is distributed on both sides of GmACP1. The length and direction of the gray arrows, representing gene length in percentage and transcription direction, respectively, were drawn according to the soybean reference genome.