
FIGURE 2.
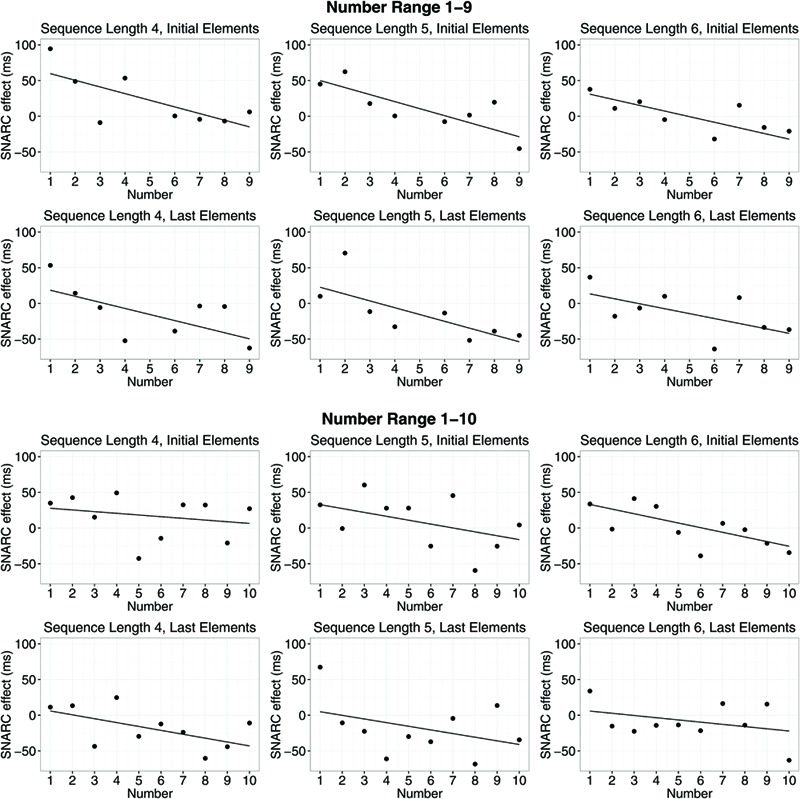
Spatial-numerical association of response codes (SNARC) effects (response times, RT) for different number ranges, sequence lengths, and positions in the sequence of memorized numbers. Dots show average RT differences of right hand minus left hand RTs. Lines indicate means of slope estimates for the interaction between number magnitude and response side (i.e., the SNARC effect).