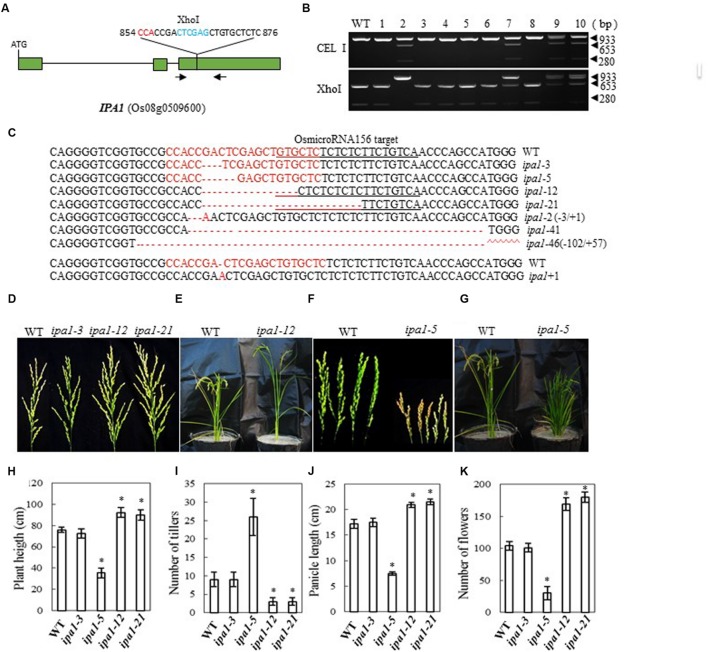
FIGURE 4.
CRISPR/Cas9-induced ipa1 mutant plants and phenotype analysis. (A) Schematic map of the genomic region of IPA1 and the sgRNA target site; arrows show the positions of PCR primers used for mutation detection; The PAM motif (NGG) is shown in red; Restriction site is shown in blue; (B) Gel electrophoresis of PCR products amplified from the mutated region digested with CEL I (upper panel) or XhoI (lower panel); WT and 1–10 are DNA samples from wild type and different transgenic plants. Arrows show the expected band sizes after CEL I or XhoI digestion; (C) Sequence alignment of the sgRNA target region showing altered bases in different mutant lines; (D) Representative pictures showing the morphology of the main panicle of wild type plants and mutants with the IPA phenotype; (E) Wild type and mutant plant with IPA phenotype grown in a greenhouse; (F) Panicle morphology of wild type plants and ipa1-5 mutant plants with a frame-shift in the coding region; (G) Phenotype of wild type, and ipa1-5 mutant plants with a frame-shift in the coding region, in the greenhouse; statistics for plant height (H), number of tillers (I), panicle length (J), and number of flowers (K) of representative mutant plants. Data were collected from 10 to 15 plants per mutant line. * indicates a significant difference (P < 0.05) in comparison to WT controls.

