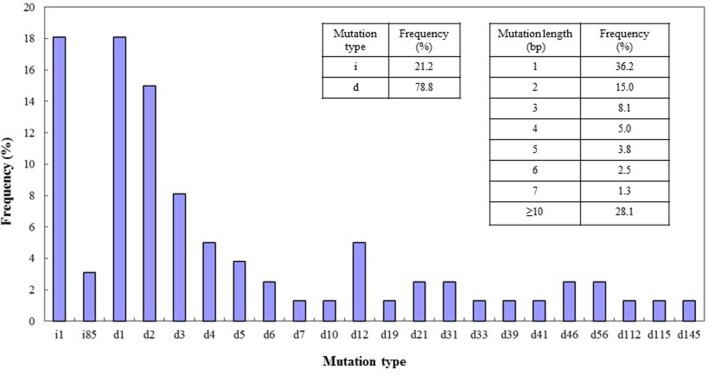
FIGURE 5.
CRISPR/Cas9-induced mutation types and frequencies. Left insert, frequencies of mutations of the deletion (d) and insertion (i) types. Right insert, frequencies of different lengths of mutation. On x-axis: d#, # of base pairs (bp) deleted from target site; i#, # of bp inserted at target site. Data were collected from lines mutated in all four of the target genes.

