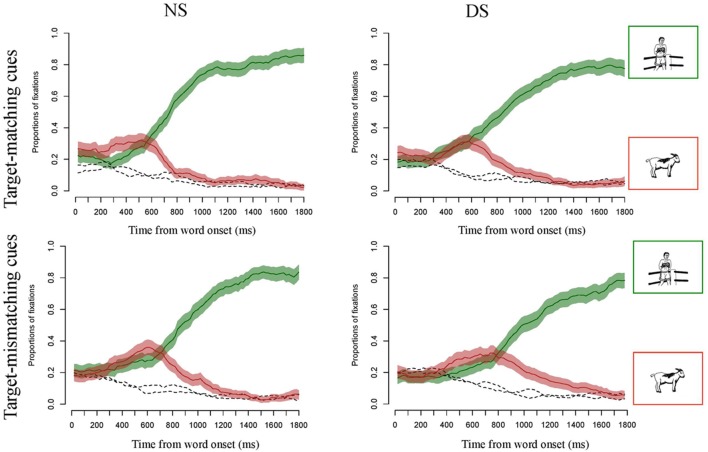
FIGURE 3.
Curves of proportions of gaze fixation over time for the target-matching and target-mismatching conditions, when presented with natural (NS) and degraded speech (DS). The green lines show the proportion of fixations averaged across participants and items and the 95% confidence intervals for target fixations, red lines show the same for competitor fixations, and the dashed black lines show fixations to the distractors.

