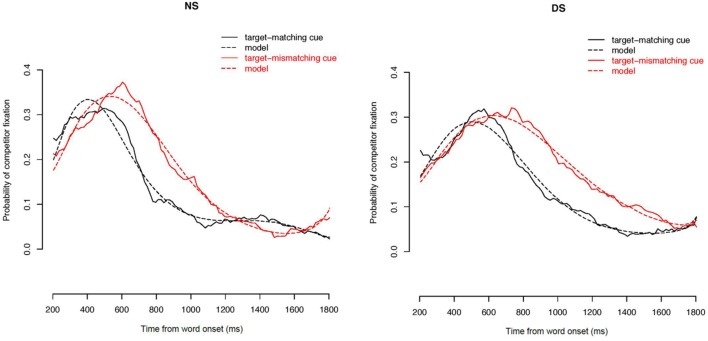
FIGURE 4.
Effect of mismatching cues in NS (left) and DS (right). The probability of fixations toward the competitor in target matching (black), and target mismatching stimuli (red) is displayed for NS and DS conditions, in the averaged data (solid lines), and in the data fitted by the statistical model (dashed).

