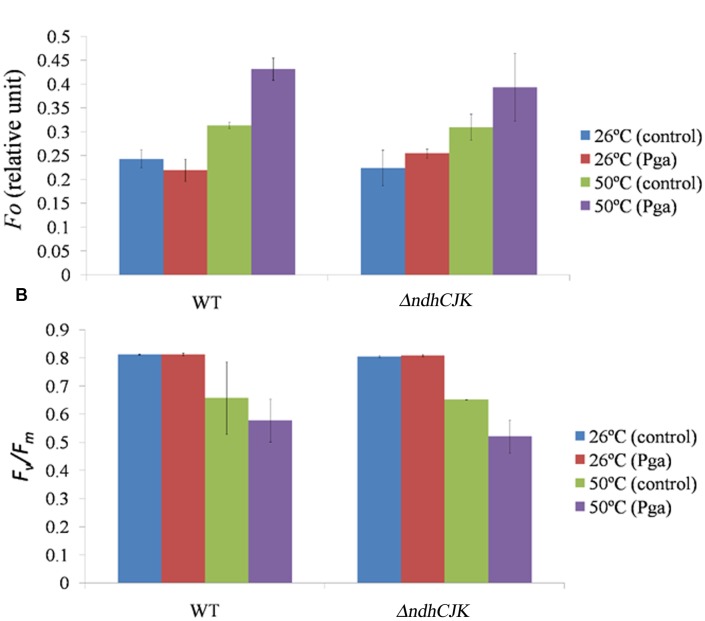
FIGURE 2.
Comparison of the chlorophyll parameters Fo level (A) and Fv/Fm(B) between WT and ΔndhCKJ of tobacco plants before (at 26°C) and after heat treatment (at 50°C for 6 h). The level of Fo was measured 15 min after dark incubation of a leaf by infiltration of 4 mM n-propyl gallate (Pga) or the same concentration of ethanol (control), respectively. Data points represent the mean ± SE of three independent measurements.

