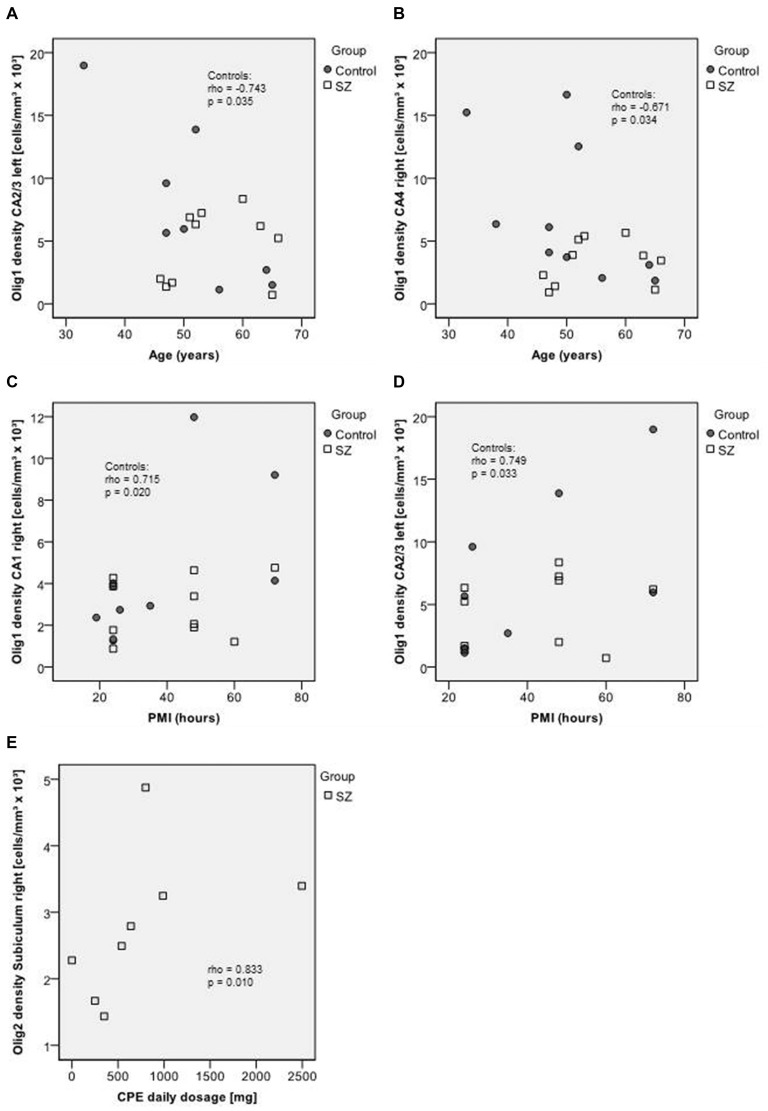
Figure 6.
Upper section (A–B): scatterplots showing the relation between age and Olig1 densities in CA2/3 left (A) and in CA4 right (B). Middle section (C–D): scatterplots showing the relation between post mortem interval (PMI) and Olig1 densities in CA1 right (C) and CA2/3 left (D). Bottom (E): scatterplot showing the relation between chlorpromazine equivalents (CPE) and Olig2 density in the right subiculum. Control subjects appear as dark circles, SZ appear as light squares.

