
Figure 3.
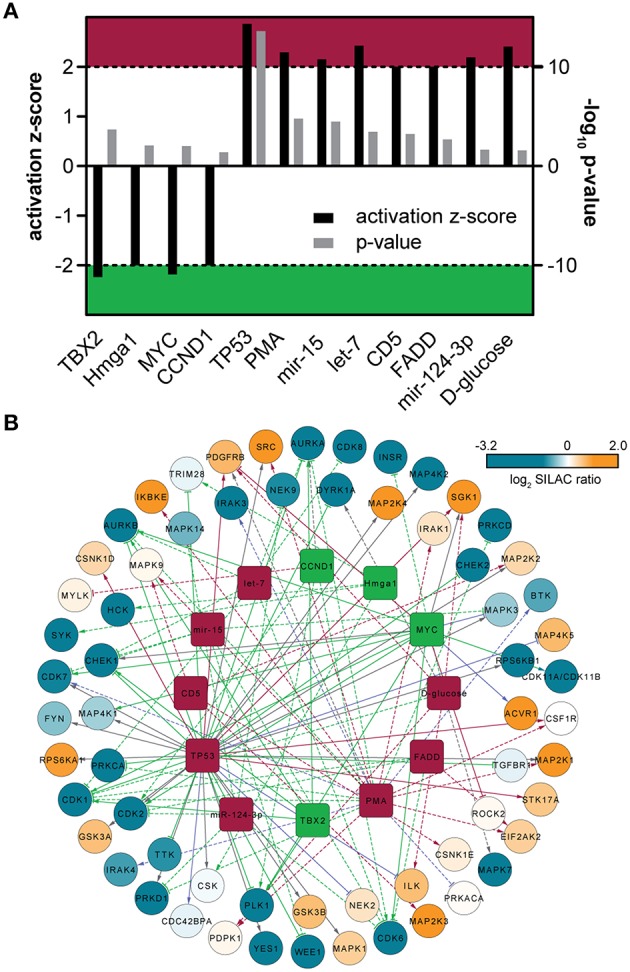
(A) Predicted upstream-regulators implicated in kinase expression changes. Bar chart includes activation z-score and p-value derived from IPA. Z-scores ≤ −2 indicate inactivity (green area), whereas z-score ≥ 2 indicate active regulators (red area). (B) Upstream-regulator network as predicted by IPA. The outer circle is composed of quantified protein kinases, which are color-coded according to their corresponding SILAC ratios. The inner circle is composed of predicted upstream-regulators that might be involved in the regulation of kinase expression. The upstream regulators are colored according to (A). Solid lines indicate direct molecular interaction, whereas dashed lines indicate indirect molecular interaction. Coloration of lines in orange, blue, gray, and purple indicates the predicted relationship of upstream-regulators with downstream protein kinases as activation, inactivation, no prediction and inconsistency with the state of downstream molecule, respectively.