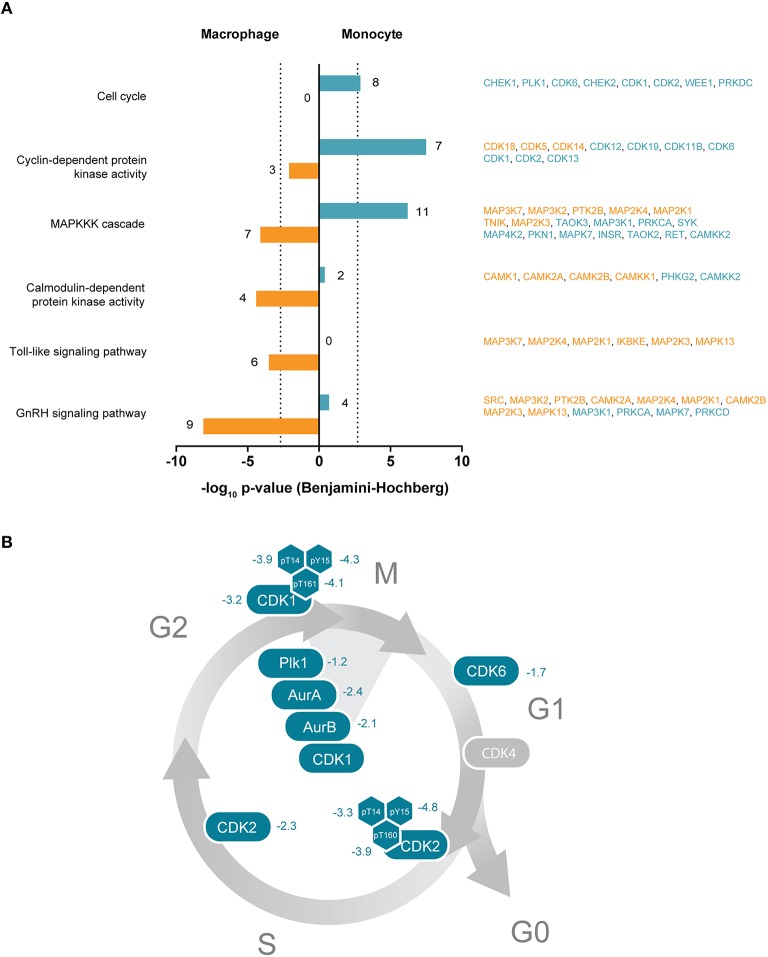
Figure 4.
(A) Selected significantly enriched GO terms or KEGG pathways of protein kinases enriched either in THP-1 macrophages or monocytes. Bars indicate Benjamini-Hochberg corrected p-values of ≤ 0.001 (dotted line). Denoted numbers indicate the number of protein kinases assigned to the respective term or pathway. Protein kinase names are provided on the right and colored according to their affiliation to the macrophage-like (orange) or monocytic (blue) cell state. (B) Schematic representation of the cell cycle with important protein kinases required for cell cycle progression and mitosis. Numbers indicate determined log2-SILAC ratios of protein kinases and phosphorylation sites with regulatory function.

