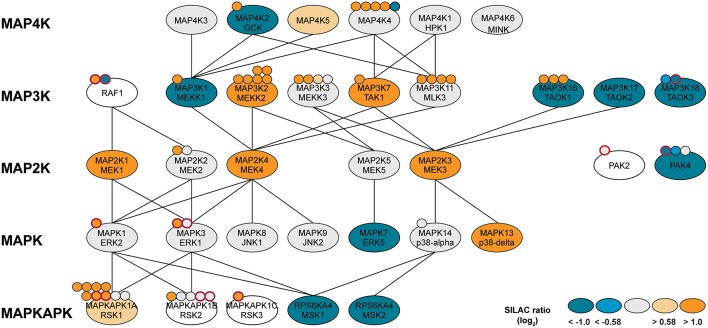
Figure 5.
MAP kinase network with identified protein kinases (ellipses) or phosphorylation sites (attached dots). Log2-SILAC ratios of macrophage-like and monocytic THP-1 cells are provided as color scheme. Phosphorylation sites with known functional implications are highlighted with a red border. Lines indicate kinase-substrate relationships obtained from the literature and online resources.

