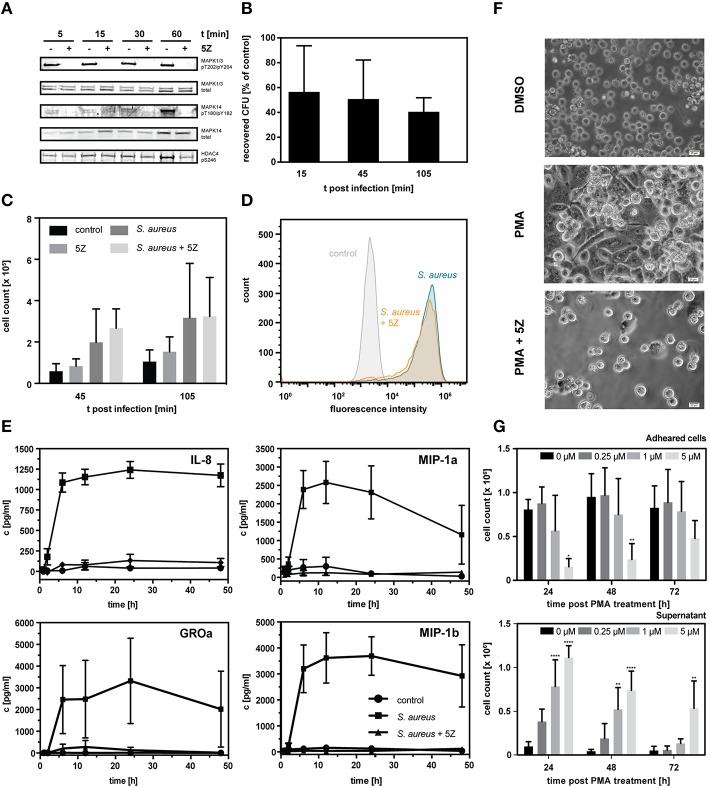
Figure 6.
(A) Western blot analysis of known downstream targets of TAK1. THP-1 monocytes were treated with 1 μM 5Z or vehicle for 1 h followed by stimulation with PMA for the indicated time periods. (B) Percentage of recovered colony forming units (CFU) of S. aureus infected THP-1 cells pretreated with 1 μM 5Z normalized to untreated THP-1 cells. Data is represented as mean ± S.D. (n = 3). (C) Count of THP-1 cells present in the cell culture supernatant in uninfected controls, following infection with S. aureus either pretreated with 1 μM 5Z or not, and uninfected controls pretreated with 1 μM 5Z. Data is represented as mean ± S.D. (n = 3). (D) Fluorescence distribution of PMA-differentiated adherent THP-1 cells infected with GFP-expressing S. aureus either pretreated with 1 μM 5Z or not and uninfected control cells as analyzed by flow cytometry. (E) ELISA-based quantification of secreted chemokines IL-8, MIP-1a, MIP-1b, and GROa following interaction with heat- inactivated S. aureus either pretreated with 1 μM 5Z or not compared to control THP-1 cells. (F) Light micrographs of THP-1 cells 3 days post PMA stimulation either with or without pretreatment with 1 μM 5Z. (G) Cell counts of THP-1 cells present either in the cell culture supernatant fraction (upper chart) or adhered fraction (lower chart) monitored over 72 h post PMA treatment in the absence and presence of different concentrations of 5Z. Data is represented as mean ± S.D. (n = 3). Statistical analysis of variance was performed by two-way ANOVA with Bonferroni post tests. *p < 0.05, **p < 0.01, ****p < 0.0001.

