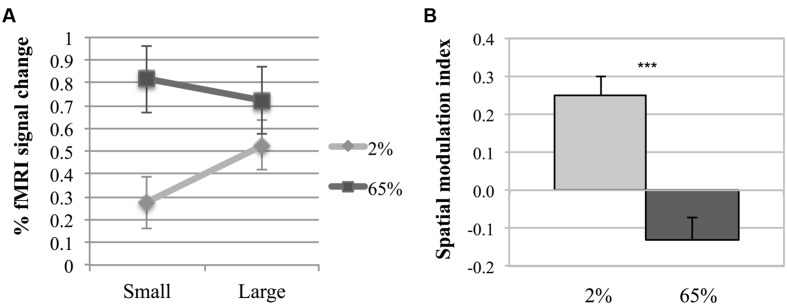
FIGURE 4.
Middle temporal activity. (A) Two-way interaction plot of the impact of size and contrast on fMRI response amplitude in MT. Error bars are 1 SE calculated across subjects. (B) Spatial Modulation Indexes (ISM). ISM is defined as the difference between fMRI response amplitudes to large and small stimuli. Asterisks indicate a statistically significant difference between the ISM-values for low and high contrasts (***p ≤ 0.001). Error bars are 1 SE calculated across subjects.

