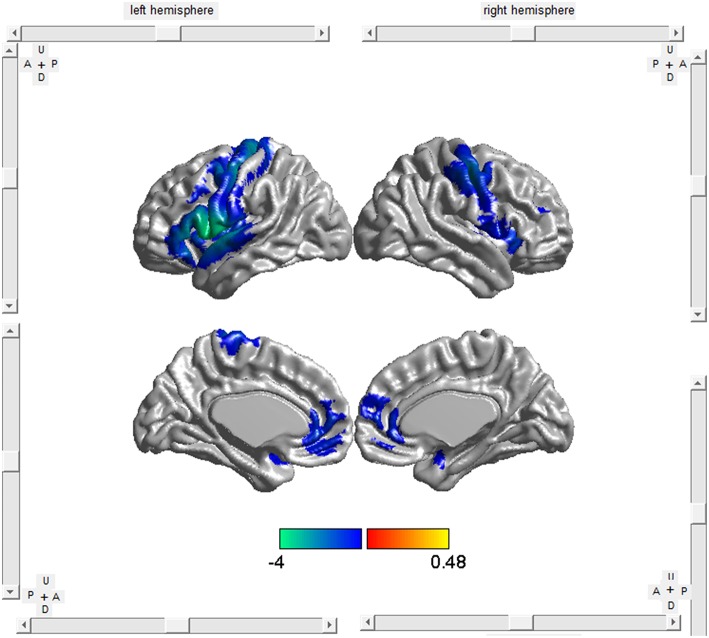
Figure 2.
Brat v1.0 (http://www.brainnetome.org/brat) software was used to visualize the anatomical distribution of GM atrophy in ALS compared with HCs. Patients with ALS had significant GM reductions in bilateral Rolandic operculum, the right precentral gyrus, the left lenticular nucleus and the right anterior cingulate/paracingulate gyri. The color bar indicates the range of the SDM-Z values.

