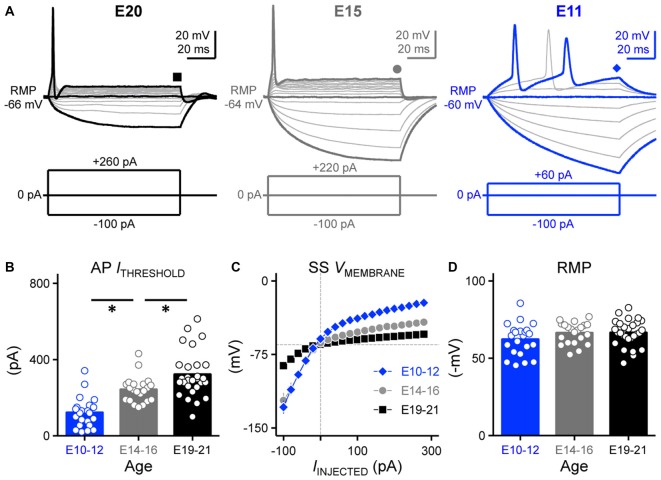
Figure 1.
Developing nucleus magnocellularis (NM) neurons showed distinct firing patterns in response to sustained current injections. (A) Representative voltage traces recorded from NM neurons at E20 (left), E15 (middle) and E11 (right) in response to a sequence of sustained current injections shown below the traces (current step = 20 pA, current duration = 100 ms). Symbols (square, circle and diamond) at the end of voltage trace represent the time window of voltage measured and plotted as a function of injected current shown in (C). Schematic representation of stimuli used to evoke responses are shown below the representative traces. (B) Population data showing threshold current for AP generation as a function of age. (C) Population data showing the voltage-current relationship for each age group. (D) Population data showing the resting membrane potential (RMP) as a function of age. Open circles represent an individual neuron and solid bars represent the average for each age group. Error bars = standard error. *p < 0.05, Bonferroni adjusted t-test.

