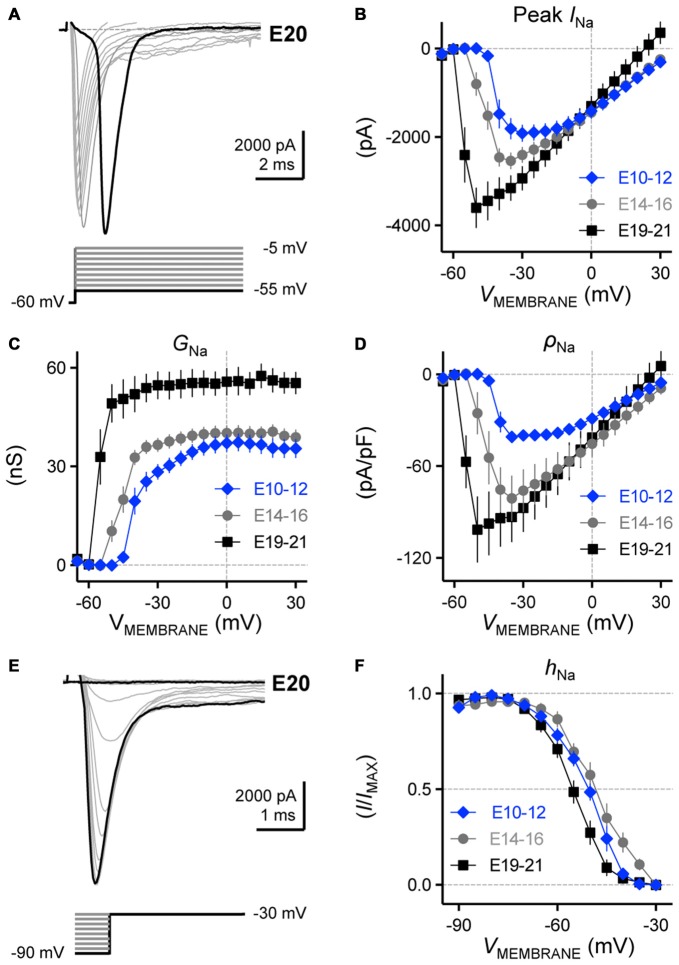
Figure 11.
Voltage dependent NaV current activation and inactivation in developing NM neurons. (A) Representative NaV current traces recorded from an E20 NM neuron in response to membrane voltages clamped from −55 to −5 mV (voltage step = 5 mV, voltage duration = 100 ms). (B–D) Population data showing the relationship of peak NaV current (peak INa, B), conductance (GNa, C) and density (ρNa, D) to the varying membrane voltages for each age group. (E) Representative NaV current traces recorded from an E20 NM neuron in response to depolarization to −30 mV following pre-pulse holding voltages clamped from −90 to −30 mV (voltage step = 10 mV). (F) Population data showing voltage dependence of NaV channel inactivation for each age group. hNa was calculated as the NaV current recorded for each trial normalized to the maximum current across all trials and plotted as a function of the pre-pulse holding voltage. Error bars = standard error.

