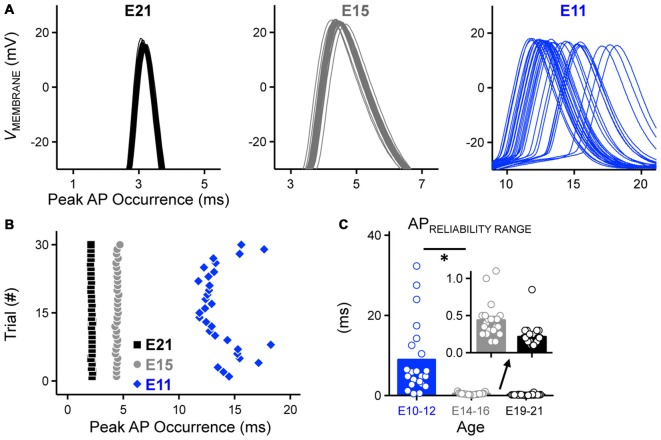
Figure 3.
Development of AP reliability in NM. (A) Partial representative AP traces (30 superimposed, interpulse stimulus interval = 2 s) showing the time of peak AP occurrence from NM neurons at E21 (left), E15 (middle) and E11 (right). Corresponding time points of AP peak are plotted as individual dots in the same time scale for all three age groups shown in (B). (B) Representative raster plot showing peak AP occurrence. (C) Population data showing changes in the range of peak AP occurrence as a function of age. Inset showing the enlarged scale of the range for E14–16 (left) and E19–21 (right). Open circles represent an individual neuron and solid bars represent the average for each age group. *p < 0.05, Bonferroni adjusted t-test.

