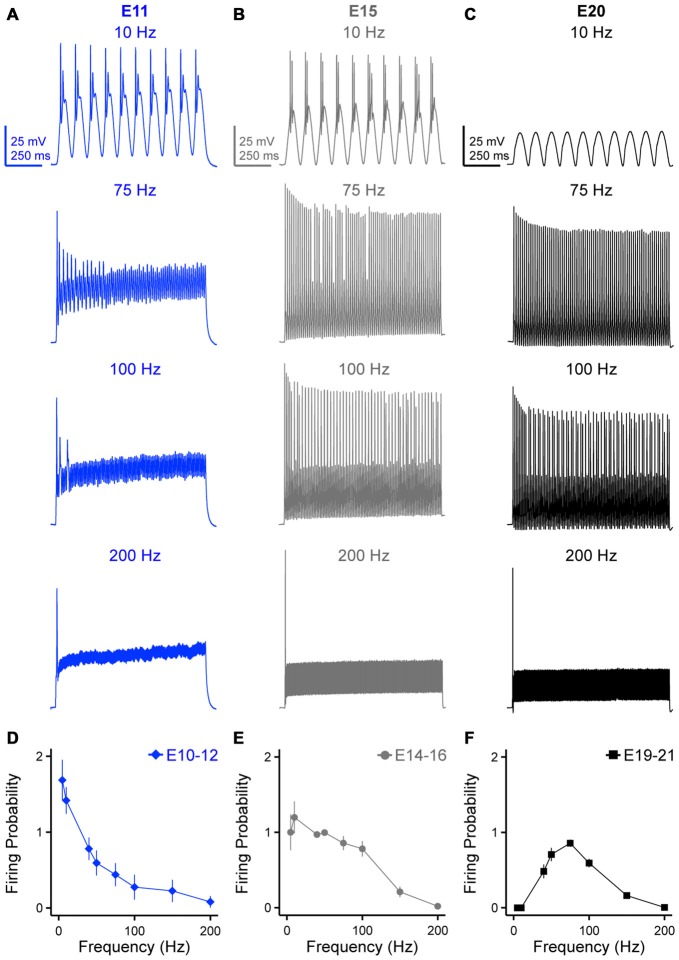
Figure 4.
Developing NM neurons show distinct firing patterns in response to sinusoidal current injections at varying frequencies. (A–C) Representative voltage traces recorded from NM neurons at E11 (A), E15 (B) and E20 (C) in response to 10, 75, 100 and 200 Hz sinusoidal current injections. The strength of sinusoidal current is 150% above threshold current. (D–F) Firing probability per sinusoidal cycle, calculated as the number of APs divided by the total number of sinusoidal cycles, is plotted as a function of stimulus frequency for NM neurons at E10–12 (D), E14–16 (E) and E19–21 (F). Error bars = standard error.

