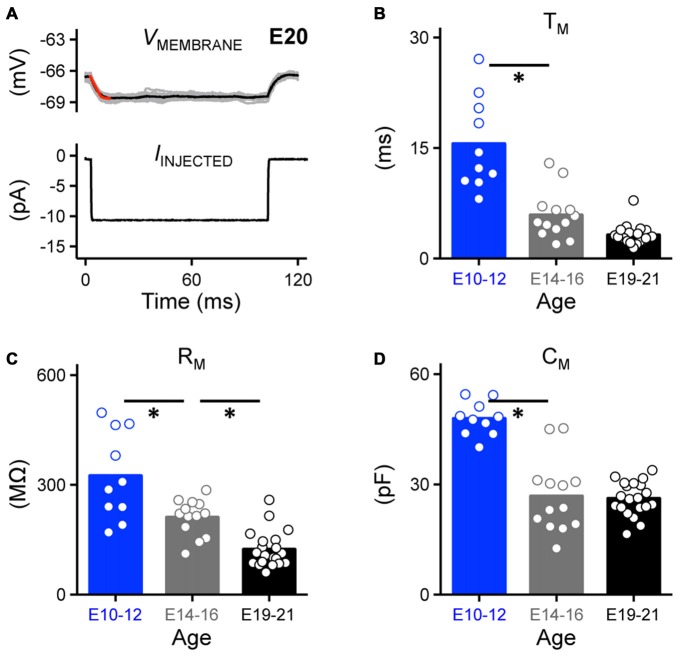
Figure 5.
Development of passive membrane properties in NM. (A) Representative voltage traces recorded from an E20 NM neuron (upper, 30 superimposed) in response to a small hyperpolarizing current (lower, −10 pA). A single exponential was fit to a 10 ms time window following the current injection (superimposed red line), in order to calculate passive membrane properties shown in (B–D). (B–D) Population data showing developmental changes in membrane voltage time constant (TM, B), membrane input resistance (RM, C) and membrane capacitance (CM, D) as a function of age. Open circles represent an individual neuron and solid bars represent the average for each age group. *p < 0.05, Bonferroni adjusted t-test.

