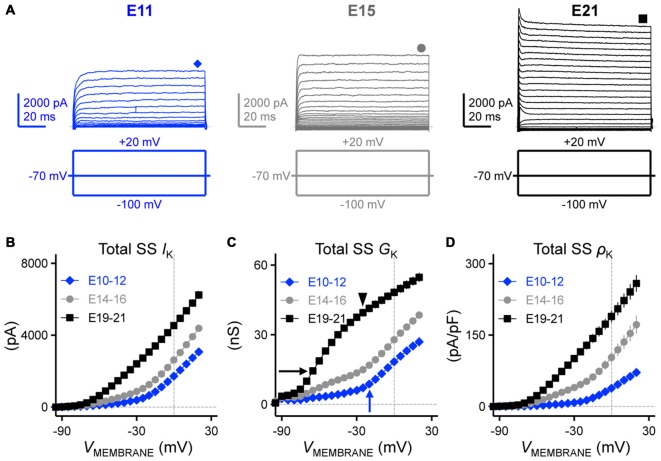
Figure 6.
Developing NM neurons showed a significant increase in total steady-state KV currents. (A) Representative KV current traces (IK) recorded from NM neurons at E11 (left), E15 (middle) and E21 (right) in response to membrane voltages clamped from −100 to +20 mV (voltage step = 5 mV, voltage duration = 100 ms). Symbols (diamond, circle and square) at the end of current traces represent time window of measured steady-state KV currents (SS IK). (B–D) Population data showing the relationship of total steady-state KV currents (SS IK, B), conductance (SS GK, C) and density (SS ρK, D) to the varying membrane voltages for each age group. Arrows and arrowhead in (C) indicate the apparent activation of distinct KV channel subtypes at different ages. Note that data points at −100 mV are not shown for simplicity.

