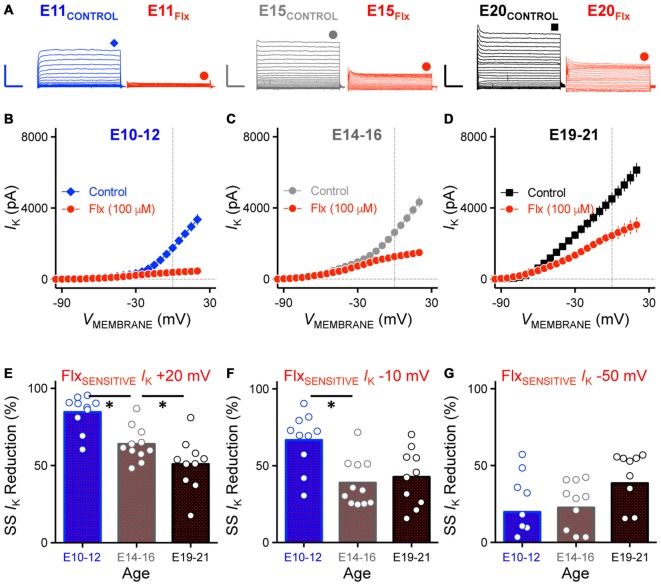
Figure 7.
Reduction of K+HVA current with Flx application was developmentally regulated. (A) Representative KV current traces recorded from NM neurons at E11 (left), E15 (middle) and E20 (right) before and during fluoxetine (Flx, 100 μM) application, in response to membrane voltages clamped from −100 to +20 mV. Flx is a potent KV3.1-containing K+HVA channel blocker. Scale bar values are 2000 pA/20 ms. Data obtained during drug application are shown in red. Symbols (diamond, circle and square) at the end of current traces represent time window of measured steady-state KV currents. (B–D) Population data showing current-voltage relationship before and during Flx application for E10–12 (B), E14–16 (C) and E19–21 (D). Note that data points at −100 mV are not shown for simplicity. (E–G) Population data showing reduction in steady-state KV currents at membrane voltage of +20 (E), −10 (F) and −50 (G) mV measured as percent change and plotted as a function of age. Note that in (G) several negative data points are not shown in the figure (2 points for E10–12, 1 for E14–16 and 1 for E19–21). Open circles represent an individual neuron and solid bars represent the average for each age group. *p < 0.05, Bonferroni adjusted t-test.

