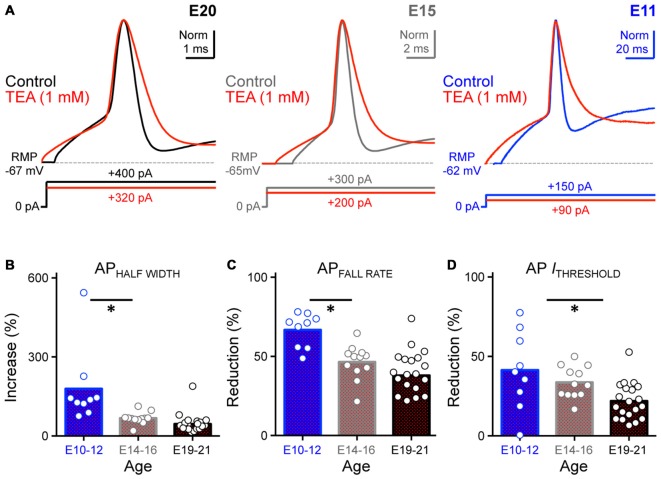
Figure 9.
Blockade of K+HVA channels altered AP kinetics of developing NM neurons. (A) Normalized representative APs recorded from NM neurons at E20 (left), E15 (middle) and E11 (right) before (control) and during bath application of low-concentration TEA (1 mM). Data obtained during drug application are shown in red. Sustained current injections are 25% above threshold current. (B–D) Population data showing percent changes in AP half width (B), fall rate (C) and threshold current (D) during TEA application, as a function of age. Open circles represent an individual neuron and solid bars represent the average for each age group. *p < 0.05, Bonferroni adjusted t-test.

