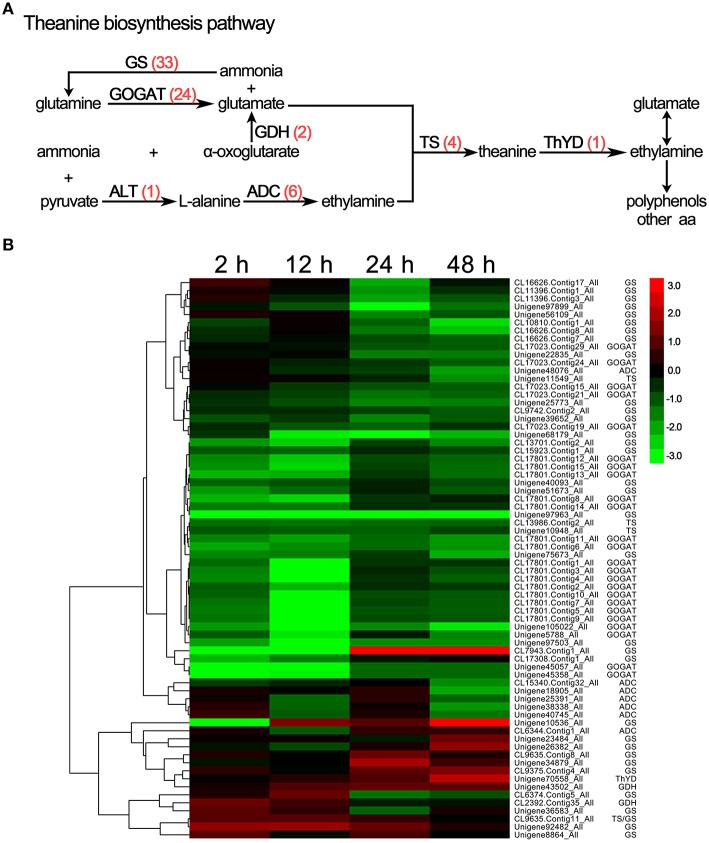
Figure 7.
DEGs involved in theanine biosynthesis in C. sinensis leaves under drought stress. (A) The theanine biosynthesis pathway. The red numbers in parentheses following each gene name indicate the number of corresponding DEGs. GS, glutamine synthetase; GOGAT, glutamate synthase; GDH, glutamate dehydrogenase; ALT, alanine aminotransferase; ADC, arginine decarboxylase; TS, theanine synthetase; ThYD, theanine hydrolase. (B) Hierarchical clustering analysis of the relative expression levels of the DEGs related to theanine biosynthetic. The FPKM ratio of unigene expression is represented on a logarithmic scale for each treatment period (2, 12, 24, or 48 h) and the control (0 h). Red indicates that a gene was up-regulated at that stage, whereas green indicates down-regulated expression.

