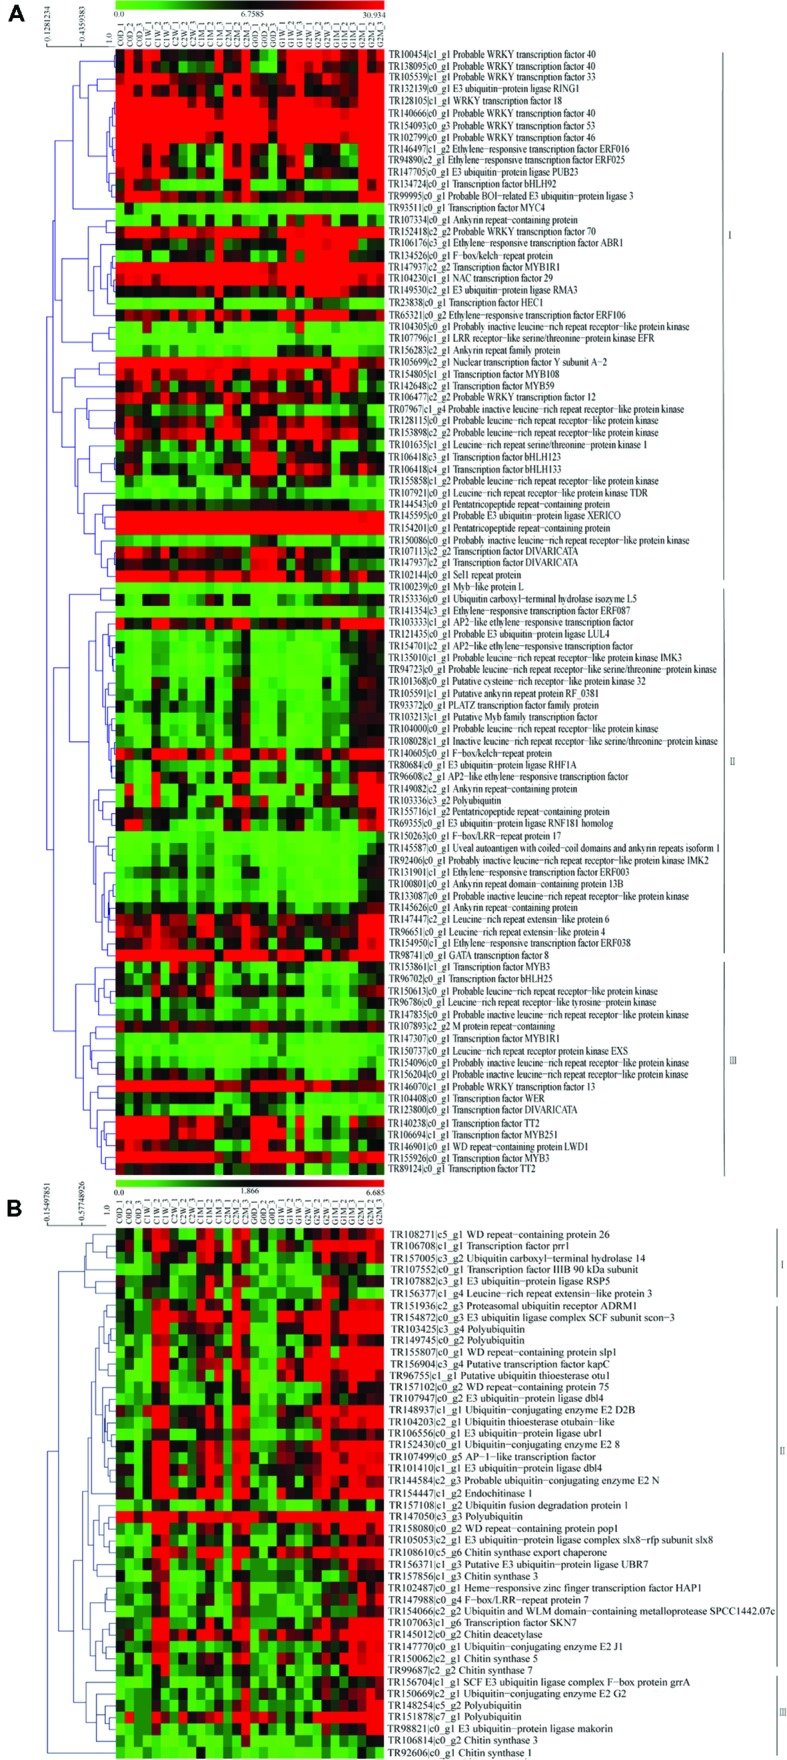
FIGURE 5.

Heat map of the genes including ubiquitination, transcription factor and repeated domain expression for litchi (A); heat map of the genes including ubiquitination, transcription factor, repeated domain expression, and chitin synthesis for AM fungi (B). The C represents control and the G represents girdling; 0 D, 1 W, 2 W, 1 M, 2 M represent the time after treatment (0 day, 1 week, 2 weeks, 1 month, and 2 months). The heat map was constructed based on the FPKM values which showed on the top of the figures by the software mev (v4.9.0).
