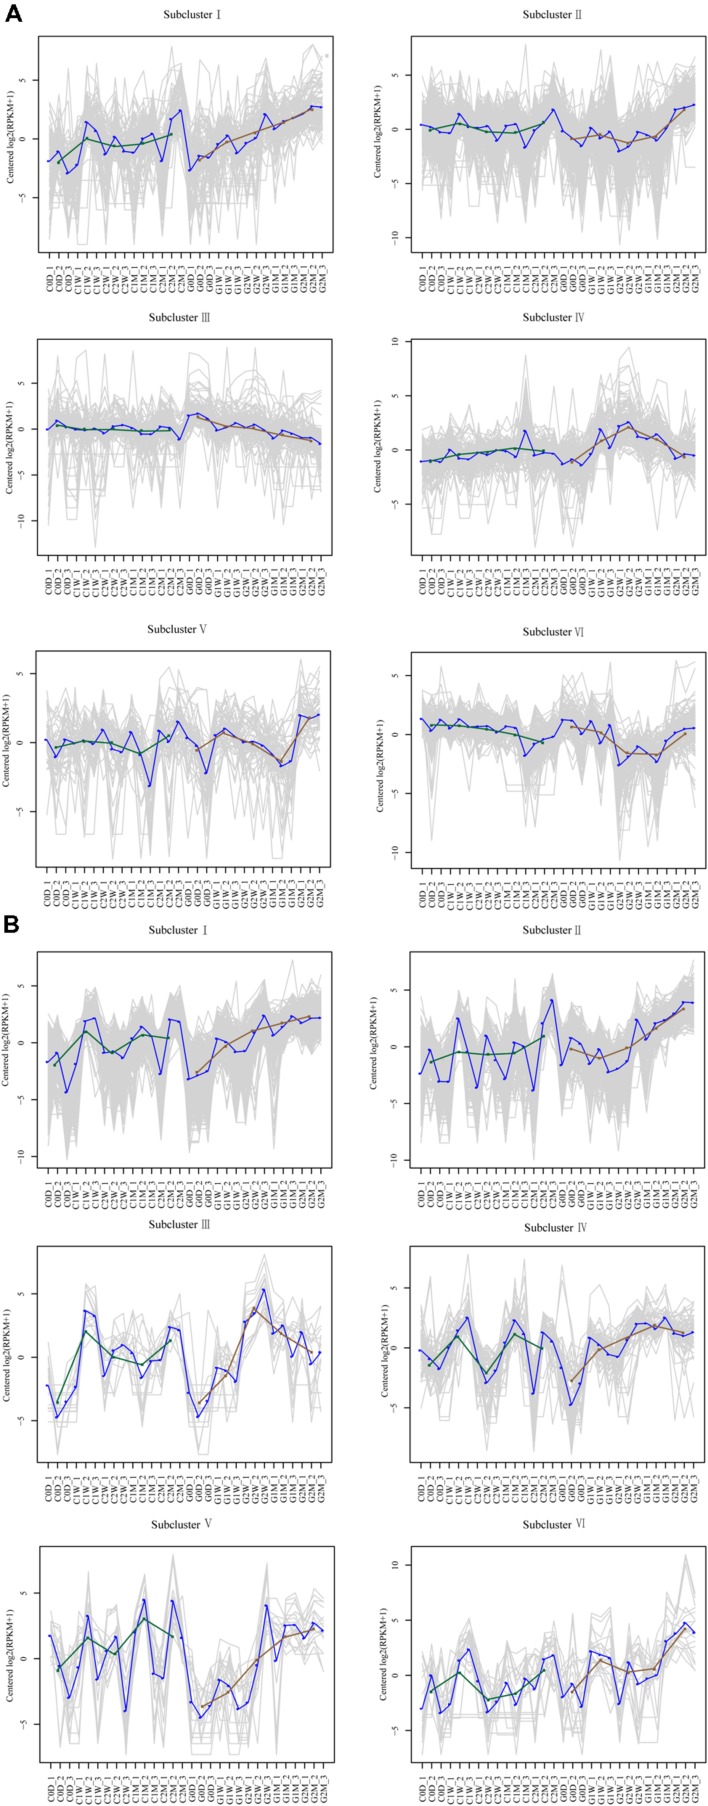
FIGURE 6.
Clustering results of time-course data from RNA-seq by short time-series expression miner analysis for litchi (A) and AM fungi (B). Each box corresponds to one of the model temporal expression profiles, and the unigene belonging to each corresponding subcluster is shown in Supplementary Table 4. The C represents control, and the G represents girdling; 0 D, 1 W, 2 W, 1 M, 2 M represent the time after treatment (0 day, 1 week, 2 weeks, 1 month, and 2 months).

