Figure 3.

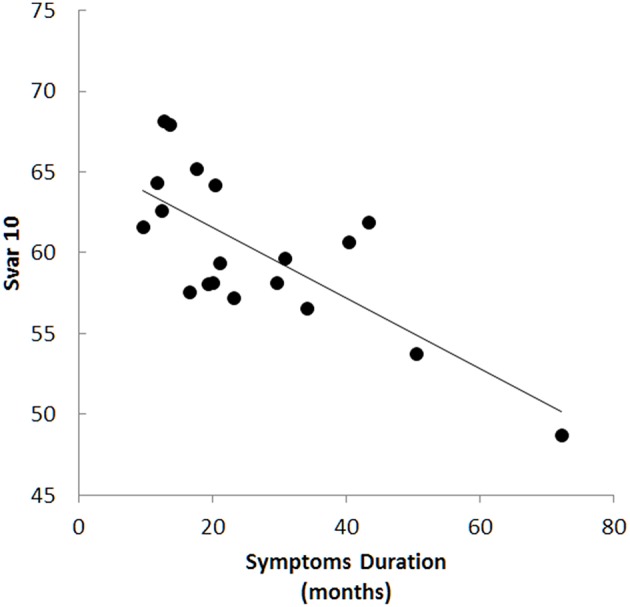
Texture changes correlated with symptoms duration in several areas and were most prominent in the precentral gyrus, for example with sum variance in cluster 10 (Svar 10, r = −0.73, p < 0.001).

Texture changes correlated with symptoms duration in several areas and were most prominent in the precentral gyrus, for example with sum variance in cluster 10 (Svar 10, r = −0.73, p < 0.001).