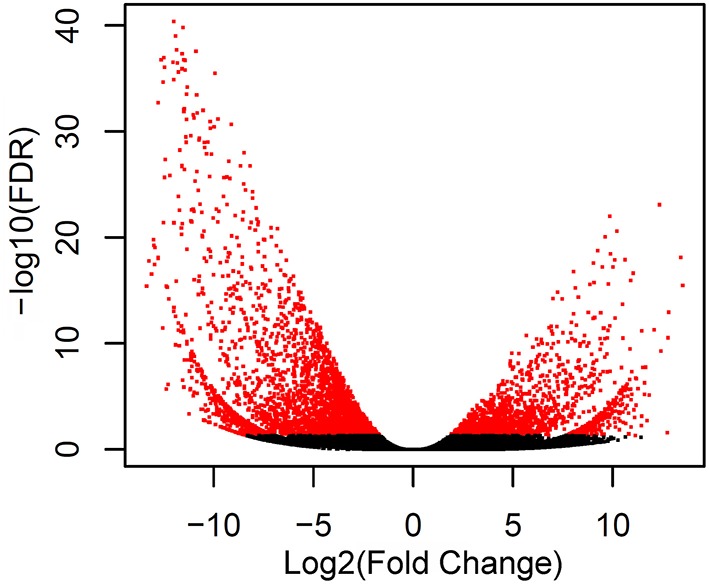
Figure 4.

Volcano plot of the transcriptome in leaf and rhizome. The horizontal line and vertical lines indicate the significance threshold (FDR < 0.05) and two-fold change threshold (|log2FoldChange|>1), respectively. The DEGs are shown with blue dots while non-DEGs are in black.
