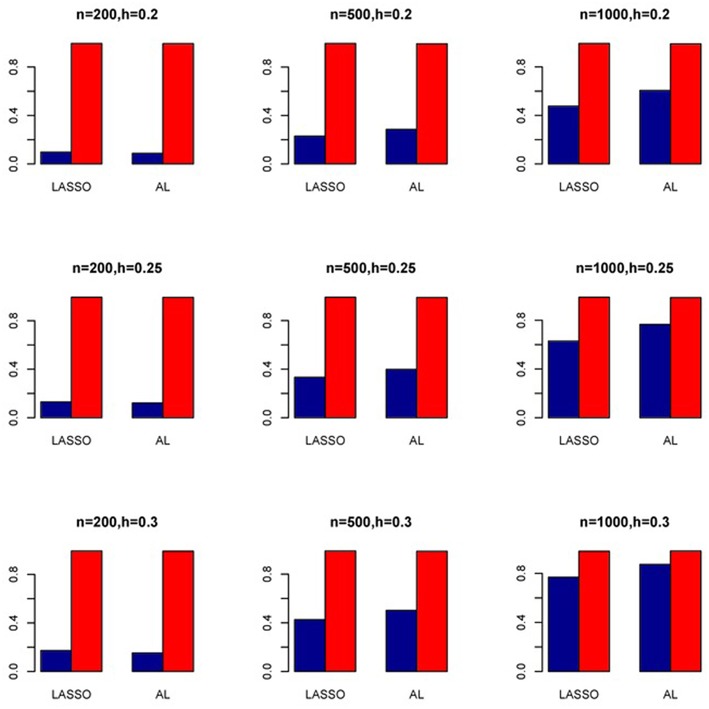
Figure 8.
Sensitivity (Red Bar) and Specificity (Blue Bar) from 1000 Replications for Independents SNPs (ρ = 0). Two methods are displayed: LASSO penalized NB regression (LASSO) and adaptive LASSO (AL) penalized NB regression. Three sample sizes (n = 200, 500, 1000) (in rows) and three marginal variances (h = 0.20, 0.25, 0.30) (in columns) are presented.

