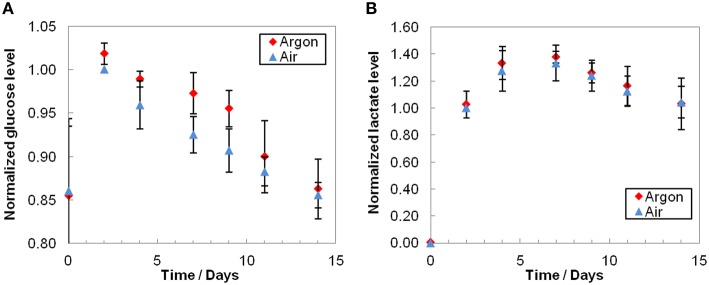
Figure 3.
Extracellular glucose consumption (A) and lactate production (B). Average results that were normalized to air day 2 conditions before averaging and are the mean relative value ± standard deviation. As expected, glucose level decreased and lactate level increased during storage. Even though the consumption of glucose was slightly higher under air condition, the difference is not significant (p > 0.1, n = 3). Lactate productions were equivalent under air or argon (p > 0.09, n = 3).

