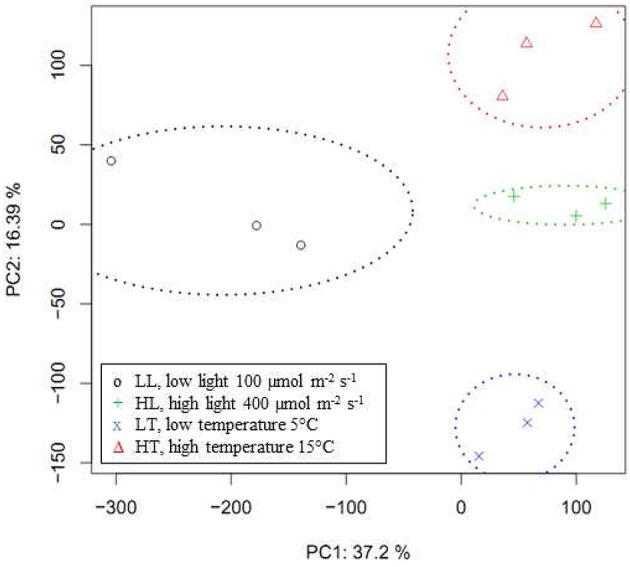
Figure 2.

Principal components analysis of expression data. Score plot of the principal components analysis of normalized Brassica Array expression values analyzed with open source microarray processing software Robin. PC1 with standard deviation of 134 explaining a proportion of variance of 0.372, and PC2 with standard deviation of 89, explaining a proportion of variance of 0.164 and a cumulative proportion of 0.536 are shown. PC3, standard deviation 75, proportion of variance 0.115, and PC4, standard deviation 60, proportion of variance 0.075 with a cumulative proportion of 0.726 are not shown.
